Explore All Resources
Search
Resource Type
Thematic
AHA Topics
Geographic

April 1, 2025
History of Deportation

January 9, 2025
Travel Policy

November 25, 2024
Criteria for Standards in History/Social Studies/Social Sciences

September 7, 2024
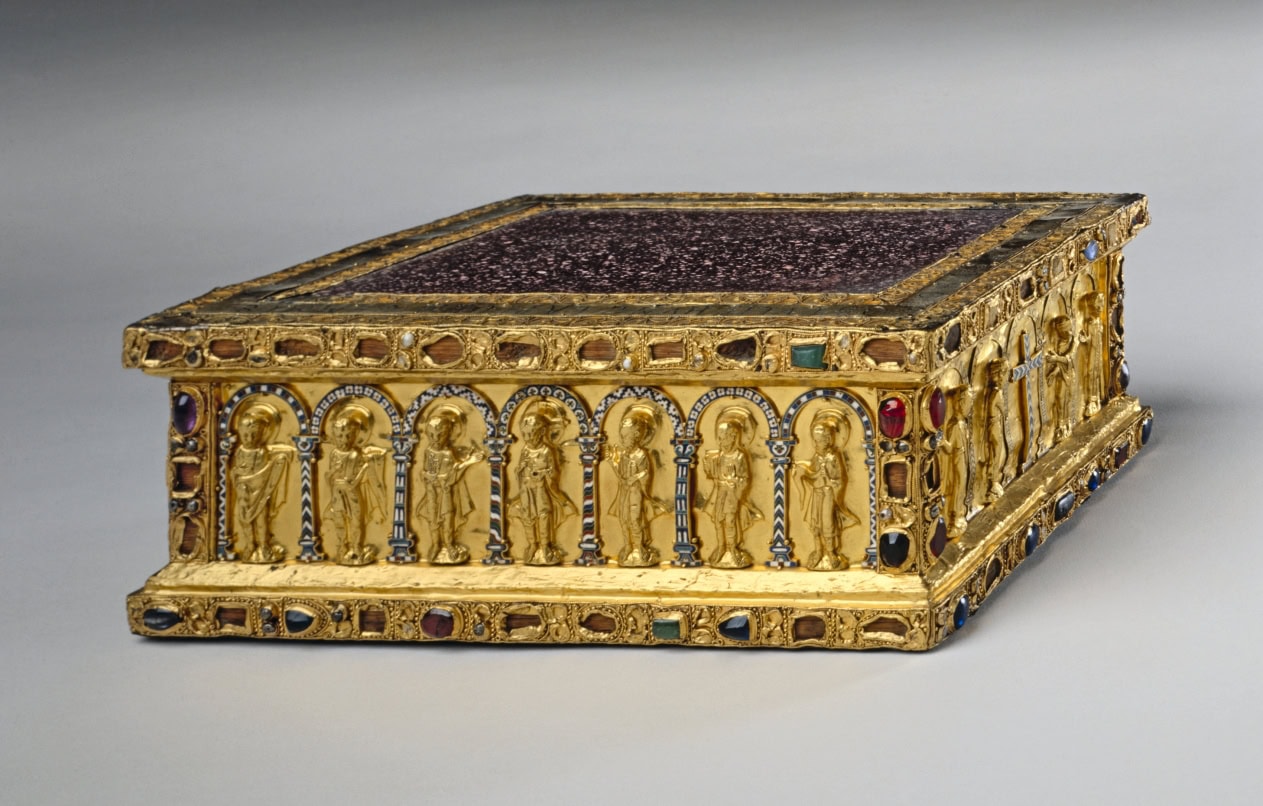
Travel and Trade in Later Medieval Africa
September 7, 2024
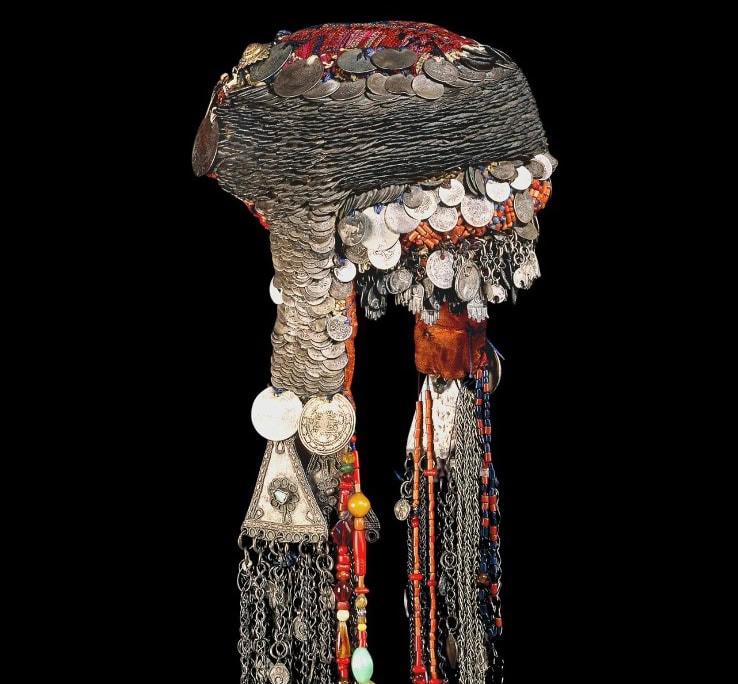
Numismatics: Coins, East Africa, and Religious Exchange
September 6, 2024
Sacred Cloth: Silk in Medieval Western Europe

September 6, 2024
Good Question: Right-Sizing Inquiry with History Teachers
Academic Department Resources
History department chairs are on the front lines of the discipline, defending historians’ work and supporting their professional lives at all stages of their academic careers. The AHA strives to strengthen this work and provide resources and opportunities that make chairs’ work easier and valued. The AHA provides resources and hosts a variety of events and opportunities to benefit department chairs and build community, including webinars, sessions at the annual meeting, and an in-person workshop.
Current Events in Historical Context
The American Historical Association promotes the critical role of historical thinking in public life. These compilations of AHA resources provide historical context to important current events. These compilations of AHA resources provide historical context to important current events.
AHA Publications
History in Focus
History in Focus is a podcast by the American Historical Review. Go behind the scenes with the world's leading history journal as we explore the who, what, how, and why of doing history in the 21st century.
The American Historical Review is the flagship journal of the AHA and the journal of record for the historical discipline in the United States, bringing together scholarship from every major field of historical study.
Perspectives on History is the newsmagazine of the AHA and is the principal source for news and information about the discipline of history. Since 1962, Perspectives has promoted our work by publishing articles and commentary on all aspects of the historical discipline.
AHA Booklets
Since the 1950s, the AHA has published booklets that address a diversity of topics to serve the needs of history students, educators, and professionals. Our publications include career advice for history graduates, overviews and syntheses of current historical topics and fields, and guides to teaching and learning in history. AHA booklets are distributed by Oxford University Press.