Summary: A majority of Americans across nearly all demographic groups surveyed recognize that interpretations of history should change, but their understandings of why those changes take place vary. Additionally, nearly two-thirds of those surveyed agreed that it is acceptable to teach history about the harm done to others, even if such an approach causes learners discomfort. The widest divisions, especially as a function of political party affiliation, surfaced when people were asked whether history should question or celebrate the nation’s past.
The term “revisionist history,” often used pejoratively, is an accusation of deliberately distorting irrefutable historical “facts” to serve a particular political agenda or viewpoint. However, when asked whether what we know about the history of people and events should ever change, a clear majority (62 percent) of our survey respondents agreed that it should (Figure 112). This is an especially salient point, given that the public overwhelmingly sees history mostly as an assembly of objective factual material (Figure 1). As such, a majority of respondents (61 percent) believed that our knowledge of the past changes only when new information comes to light, as opposed to when extant facts are reinterpreted (Figure 113). Indeed, those harboring such a facts-based view of history were least likely to think that our understanding of the past should ever shift (Figure 114). This indicates a belief that history is immutable, whereby revisionism is something to be viewed with skepticism. When broken out by age, the differences in views about the mutability of the past are only minor (ranging from 60–65 percent), with the youngest group, 18- to 29-year-olds, most likely to agree that historical understandings should change (Figure 115). We see more significant differences when education level is considered: 77 percent of respondents with a college degree believe interpretations of history should alter, while only 54 percent (still a majority) of those without a college education agree (Figure 116).
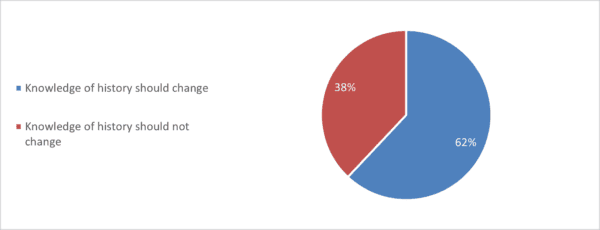 Figure 112: Survey respondents’ views on whether knowledge of the history of people and events should ever change. (HR1)
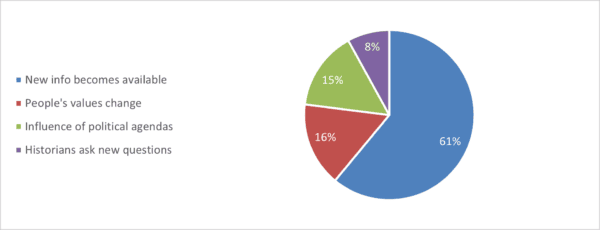 Figure 113: Survey respondents’ views on why understandings of the past can change. (HR2)
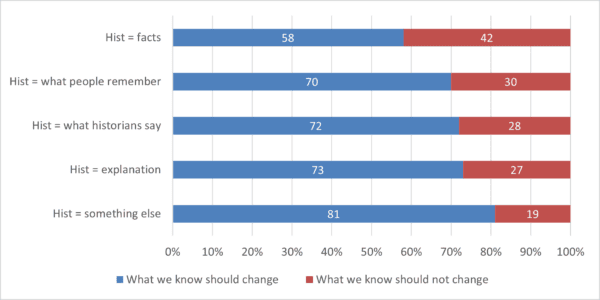 Figure 114: Respondents’ views on whether knowledge of the past should ever change as a function of respondents’ views on the nature of history. (D1 x HR1)
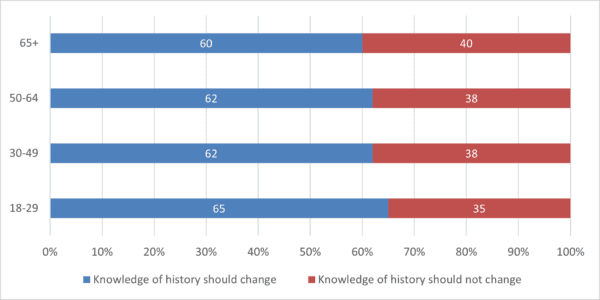 Figure 115: By age group: Respondents’ views on whether knowledge of the history of people and events should ever change. (HR1)
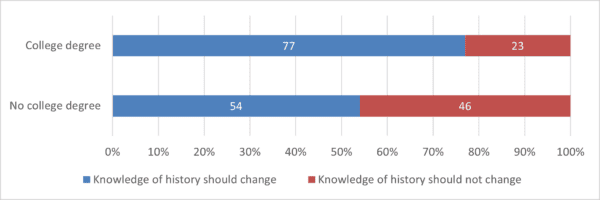 Figure 116: By education level: Respondents’ views on whether knowledge of the history of people and events should ever change. (HR1)
However, when examined through the lens of either race/ethnicity or political party affiliation, we see three outliers in attitudes toward revisionist history. For Hispanic respondents (Figure 117) and those identifying as Republicans or no party preference (Figure 118), a slight majority (52 percent each) believed that interpretations of history should not change. Such figures juxtapose considerably with those of whites and Blacks (Figure 117) and Democrats and independents (Figure 118).
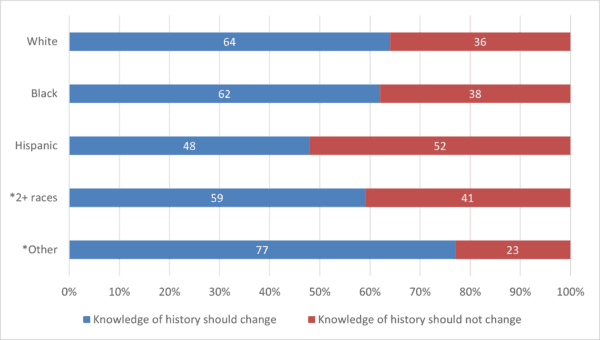 Figure 117: By race/ethnicity: Respondents’ views on whether knowledge of the history of people and events should ever change. *Fewer than 100 responses. (HR1)
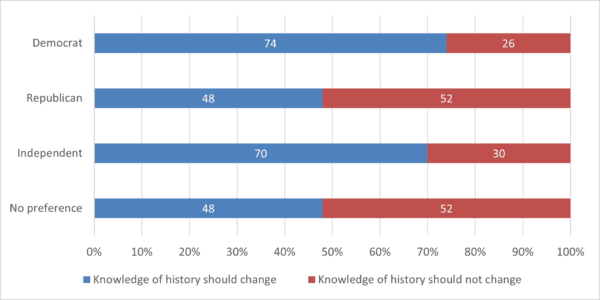 Figure 118: By political party: Respondents’ views on whether knowledge of the history of people and events should ever change. (HR1)
To our survey respondents, it is that variable nature of historical knowledge that makes it particularly difficult to grasp. A related poll item asked respondents to reflect on the complexity of the discipline, particularly whether learning history is challenging because basic facts and our understandings thereof do or do not shift. Sixty-three percent admitted to the complexity of the past due to changing understandings of basic facts (compare this with the 62 percent who felt historical knowledge should change in Figure 112). The connection between malleable historical knowledge and difficulty understanding the past filtered down to age bracket subgroups (Figure 119; compare with Figure 115), to education demographics (Figure 120; compare with Figure 116), to racial/ethnic groups (Figure 121; compare with Figure 117), and rather starkly to political parties (Figure 122; compare with Figure 118). Here, we note that Republicans were the sole respondents where only a minority (45 percent) thought learning history was difficult—most likely because this group’s conception of the historical record was static.
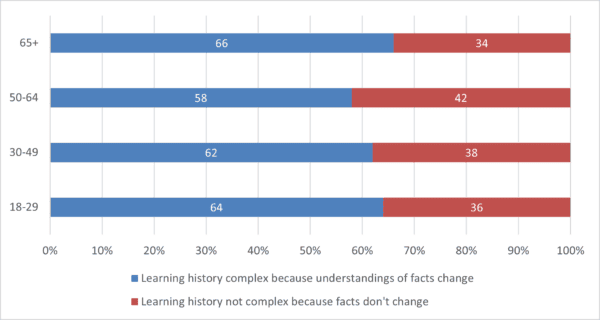 Figure 119: By age group: Respondents’ views on complexity of learning history as function of changing facts. (V1)
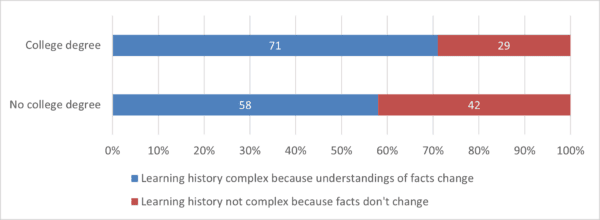 Figure 120: By education level: Respondents’ views on complexity of learning history as function of changing facts. (V1)
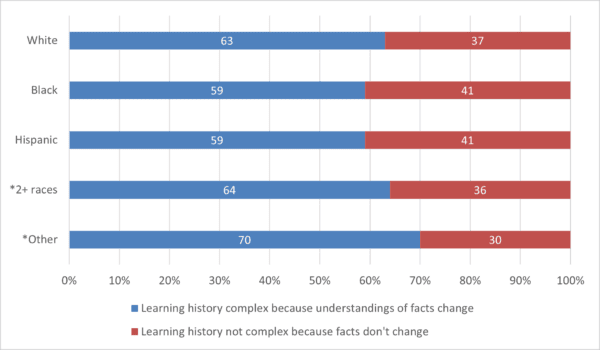 Figure 121: By race/ethnicity: Respondents’ views on complexity of learning history as function of changing facts. *Fewer than 100 responses (V1)
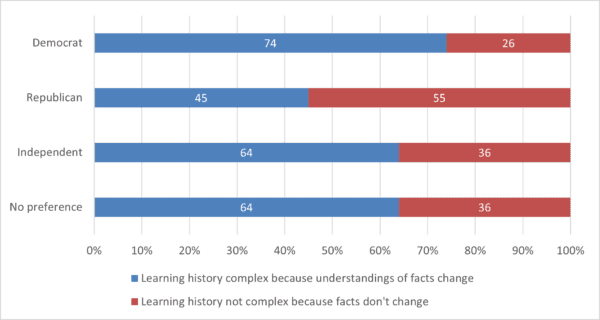 Figure 122: By political party: Respondents’ views on complexity of learning history as function of changing facts. (V1)
As we consider attitudes about revisions to historical interpretation and the work that historians do, we must also reflect on attitudes and priorities regarding how this history is taught—in high school and college classrooms, museums, and historic sites. The data reveal some predictable divisions and perhaps some surprising commonalities among the demographic subgroups surveyed.
When asked whether history should celebrate or question the nation’s past, there was a relatively even split among all respondents, with 47 percent believing history should question America’s past while 53 percent think history should celebrate it (Figure 123). The divisions become wider when accounting for age, education level, and race/ethnicity. The youngest respondents, 18- to 29-year-olds (57 percent), were more likely than older respondents (42–48 percent) to agree that history should question America’s past (Figure 124). A majority of college-educated respondents (57 percent) believed the nation’s past should be questioned, compared to only 42 percent of those without college degrees (Figure 125). Whites (58 percent) were somewhat or greatly more likely than respondents of color (51 percent Hispanics, 31 percent Blacks) to believe that the past should be celebrated (Figure 126). Some regional differences showed up on this matter, but those differences were not particularly broad (Figure 127). Most strikingly, 84 percent of Republicans thought that history should celebrate our nation’s past, while 70 percent of Democrats said that history should question it (Figure 128).
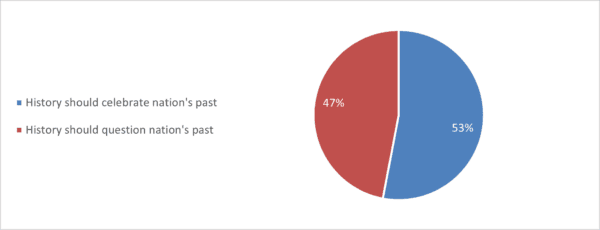 Figure 123: Survey respondents’ views on whether history should celebrate nation’s past. (V12)
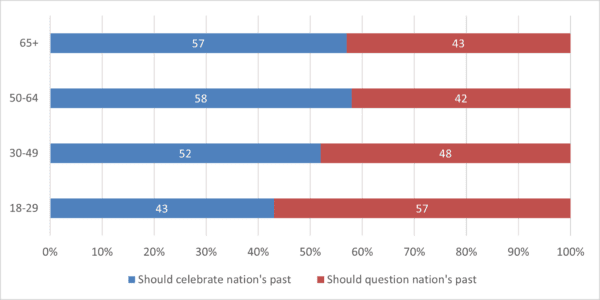 Figure 124: By age group: Respondents’ views on whether history should celebrate nation’s past. (V12)
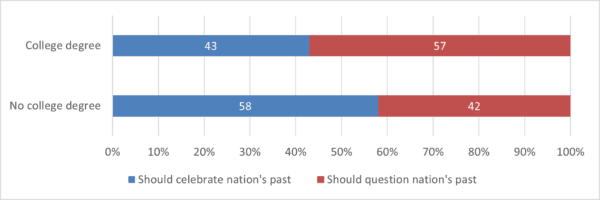 Figure 125: By education level: Respondents’ views on whether history should celebrate nation’s past. (V12)
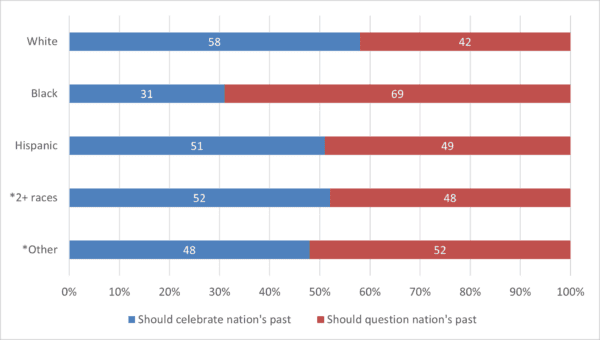 Figure 126: By race/ethnicity: Respondents’ views on whether history should celebrate nation’s past. *Fewer than 100 responses. (V12)
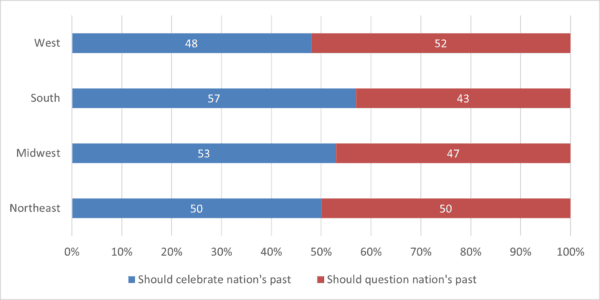 Figure 127: By region: Respondents’ views on whether history should celebrate nation’s past. (V12)
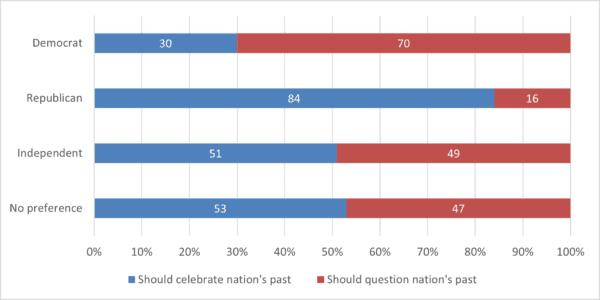 Figure 128: By political party: Respondents’ views on whether history should celebrate nation’s past. (V12)
The “history wars” are evident in legislation currently introduced in at least 26 states that would restrict the discussion of “divisive concepts” in public education institutions. There is clear partisan division between Republicans who support these bills and Democrats who oppose them. However, the survey data reveal that regardless of political identity—or even age, race, gender, or education level—most Americans agree that honest reckoning with their histories is needed, even if that history makes learners feel uncomfortable. Thus, the “history wars” making headlines and causing so much strife are somewhat of a chimera, insofar as the agendas being pushed by political figures are often unreflective of the will of their constituents.
Asked whether it was acceptable to make learners uncomfortable by teaching the harm some people have done to others, over three-fourths of respondents said it was (Figure 129). That breakdown remained largely constant across age groups (Figure 130), education levels (Figure 131), genders (Figure 132), and geographic locations (Figure 133). Even by political affiliation the similarities held steady, with 78 percent of Democrats and 74 percent of Republicans supporting the appropriateness of confronting painful history (Figure 134). The only outlier here was among Hispanic respondents, where just 58 percent—still a clear majority—defended making history learners uncomfortable (Figure 135).
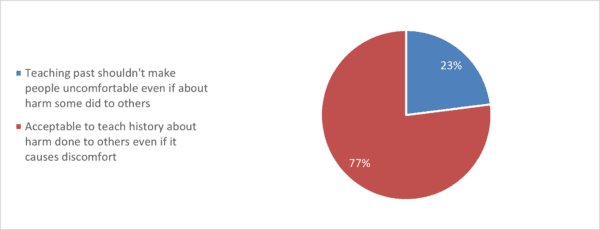 Figure 129: Survey respondents’ views on uncomfortable history. (V7
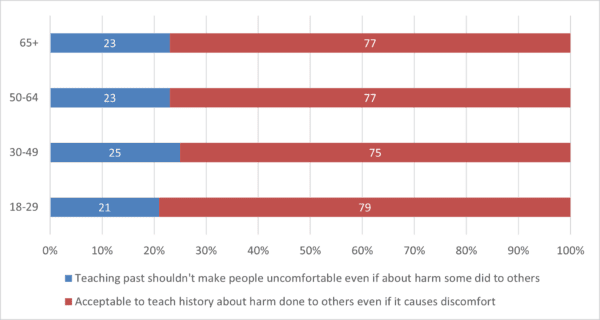 Figure 130: By age group: Respondents’ views on uncomfortable history. (V7)
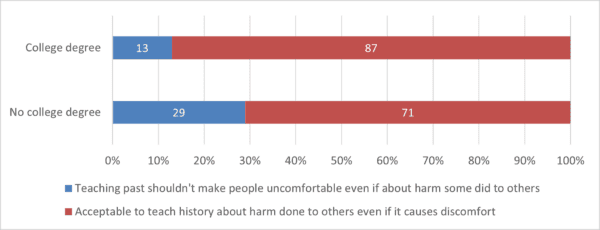 Figure 131: By education level: Respondents’ views on uncomfortable history. (V7)
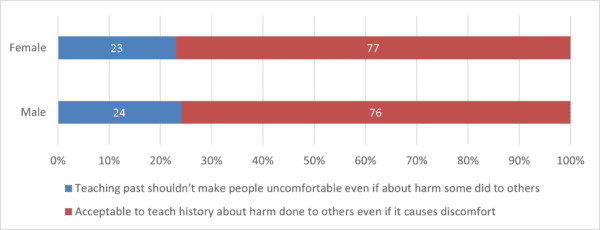 Figure 132: By gender: Respondents’ views on uncomfortable history. (V7)
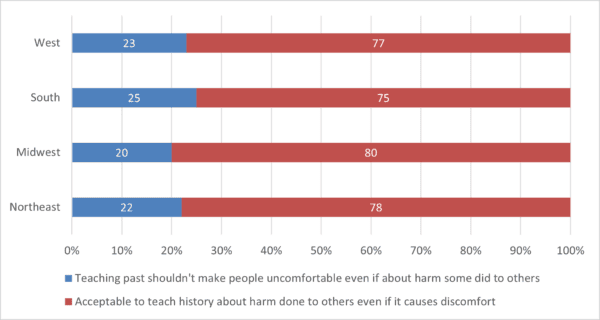 Figure 133: By region: Respondents’ views on uncomfortable history. (V7)
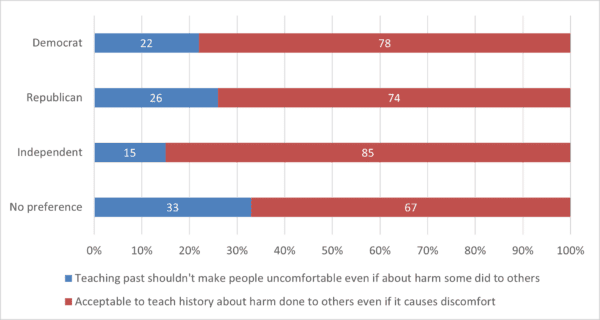 Figure 134: By political party: Respondents’ views on uncomfortable history. (V7)
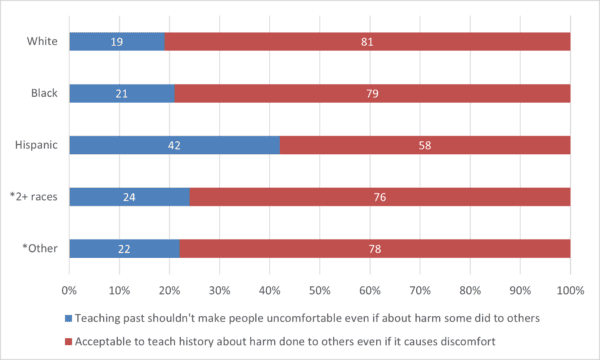 Figure 135: By race/ethnicity: Respondents’ views on uncomfortable history. *Fewer than 100 responses. (V7)
Another clear majority—90 percent of respondents overall, and never less than 88 percent of any demographic subgroup—indicated that when history makes them feel uncomfortable, they choose to further investigate rather than avoid it (Figure 136; compare with Figure 50). Those numbers remained remarkably steady, never varying by more than just a few points, across all demographics studied here. We note that such views may be more aspirational than real: only further research could determine whether respondents actually follow through on their pledge to delve into distressing material or actively seek out information that questions assumed facts. Nevertheless, the data underscore how out-of-step current legislative efforts are in attempting to curtail examination of painful topics in US history. This mirrors other political hot-button issues such as gun purchase background checks, where legislators routinely block increased regulation despite overwhelming support of their constituents across the political spectrum.
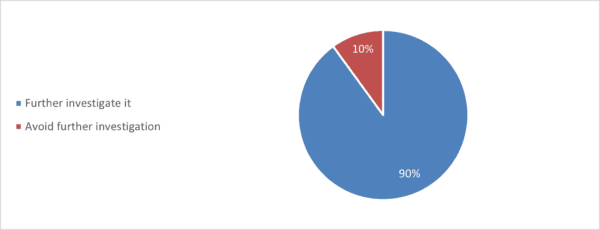 Figure 136: Respondents’ reported action taken when encountering uncomfortable history. (V11)
Challenges and opportunities: Although current political divisions about the purposes and priorities of teaching history in public institutions are significant, Americans, regardless of age, race/ethnicity, gender, education level, or political identity, are eager and willing to learn about histories that make them uncomfortable. It is likewise evident that a belief in the historical record as unchanging is associated with an understanding that history is primarily an agglomeration of facts, as opposed to a dynamic field that is constantly being reassessed. Shifting the focus from simply knowing the past to understanding its fluid properties and innate complexity would surely help, but such change constitutes a heavy lift for both the public and the professionals who serve them.