Summary: The public has various reasons for taking interest in history. In correlating those interests with a selection of civic activities, we found minor effects. Stronger factors in whether respondents were engaged in their communities are age, education level, race/ethnicity, and even political affiliation. Nevertheless, we also learned that those who expressed no interest in learning about the past were consistently among the least civically active.
Those of us working in history fields want the public to be more informed about the past, and to use that knowledge responsibly for the betterment of society. In that vein, we hope that such knowledge translates to greater civic engagement, history-related or otherwise. Does such a link exist? Drawing such causal connections is inherently difficult, but our data lead us to believe that advanced education and some forms of interest in the past are conducive to increasing people’s civic involvement.
Consider survey respondents’ reported participation in community problem-solving since January 2019. Topline figures showed a 14 percent involvement rate, but that number was higher (admittedly, not by much) for those expressing interest in simply being informed about the past or wanting to share such information with their children. At the same time, those with only a passive interest in history (i.e., who find it entertaining) or an educational requirement to develop one, trailed the pack, while people with an overt lack of interest in history were only about one-third as likely to be active participants in community affairs (Figure 137). But the effects of other variables loom larger. Higher education seems to be a key factor, with degree holders twice as prone as non–college graduates to engage in local problem-solving (Figure 138). Disparities also appear as a function of race/ethnicity, where Blacks, regardless of education level, reported about the same level of activity as college graduates, but Hispanics were less than half as involved (Figure 139). Otherwise, differences as a matter of age group, gender, and political party affiliation were small.
-600x350.png) Figure 137: Respondents’ involvement in community problem-solving as a function of motives to learn history. (CE1 x S6)
Figure 137: Respondents’ involvement in community problem-solving as a function of motives to learn history. (CE1 x S6)
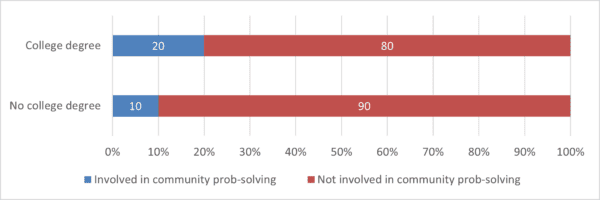 Figure 138: By education level: Respondents’ involvement in community problem-solving. (CE1)
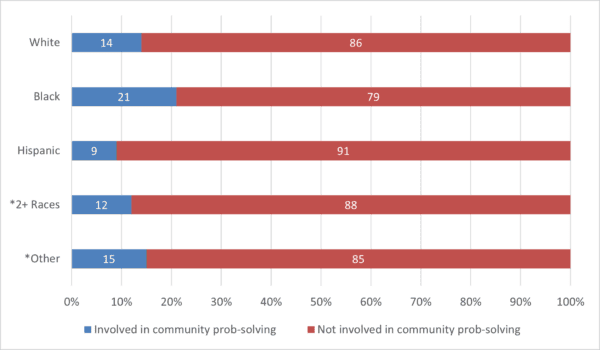 Figure 139: By race/ethnicity: Respondents’ involvement in community problem-solving. *Fewer than 100 responses. (CE1)
We see a similar pattern play out in the related activity of volunteer work since early 2019. Once again, the topline figure of involvement (30 percent) is a bit lower than the 36 percent for people expressing a general interest in history, and about on par with figures for other motives. A lack of interest in history is negatively correlated with volunteerism by a wide margin (Figure 140). College education (Figure 141) and race (Figure 142) are two other key variables in predicting volunteer activities, though in this case, whites’ involvement exceeds that of people of color by double digits.
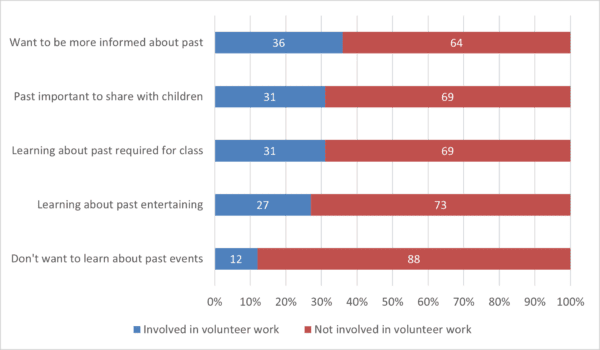 Figure 140: Respondents’ involvement involunteer work as a function of motives to learn history. (CE3 x S6)
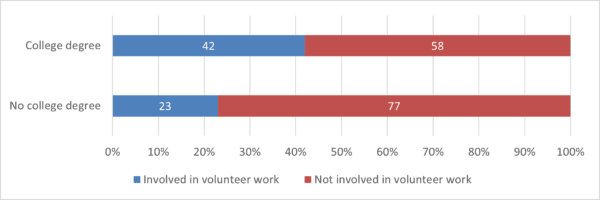 Figure 141: By education level: Respondents’ involvement involunteer work. (CE3)
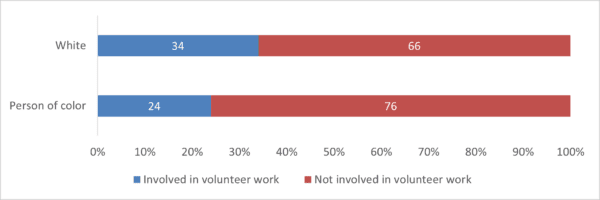 Figure 142: By race: Respondents’ involvement involunteer work. (CE3)
Political engagement might track with historical curiosity, as sometimes happened in the case of respondents’ contact with an elected official. Twenty-two percent in the overall survey reported such contact, a number equaled or exceeded by those with a general or legacy interest in the past. Those looking to history merely for entertainment or as an educational obligation were less prone to be in touch with a public official, while an expression of uninterest in history was associated with the lowest such activity (Figure 143). In this case of civic engagement, age was likewise a factor, with older respondents being far more likely than younger ones to call on representatives (Figure 144). Greater or lesser involvement as a matter of college education (Figure 145) or race (Figure 146) mirror what we saw in the preceding example of volunteerism. Breaking down the race category further indicates that white men and women were about twice as likely to contact elected officials than were people of color, whether male or female (Figure 147).
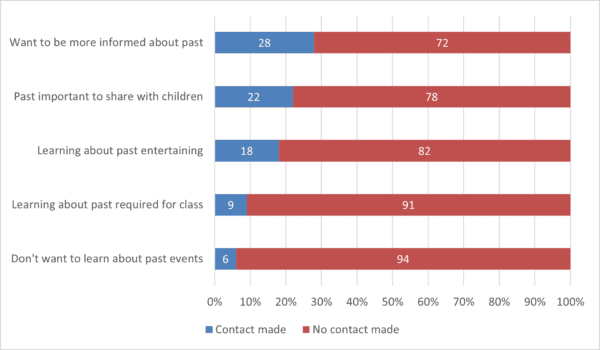 Figure 143: Respondents’ contact with an elected official to express an opinion or concern as a function of motives to learn history. (CE4 x S6)
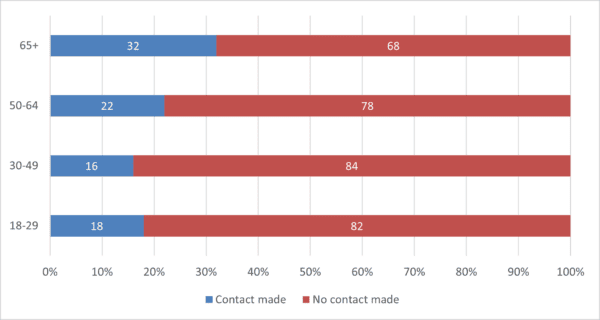 Figure 144: By age group: Respondents’ contact with an elected official to express an opinion or concern. (CE4)
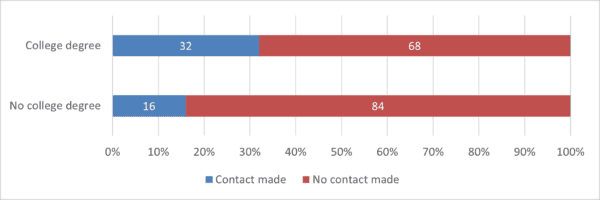 Figure 145: By education level: Respondents’ contact with an elected official to express an opinion or concern. (CE4)
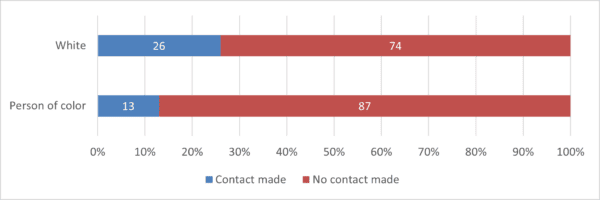 Figure 146: By race: Respondents’ contact with an elected official to express an opinion or concern. (CE4)
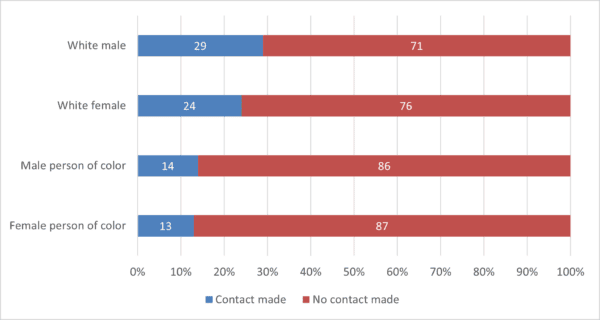 Figure 147: By gender/race/ethnicity: Respondents’ contact with an elected official to express an opinion or concern. (CE4)
The ultimate manifestation of civic engagement is arguably the act of voting. Overall, 52 percent of survey respondents told us they always voted, with another 40 percent indicating variable voting patterns and the remaining 8 percent not registered to vote. Once again, we see those with a general interest in wanting to know more about the past being notably more active than topline figures: 59 percent unfailingly voted, while only 4 percent were not registered. But other motives for being historically informed did not fare as well, with adherents falling below or above the always voting/unregistered thresholds, respectively. For once, those with no interest in the past did not come in last place as stalwart ballot casters, though they did bring up the unregistered rear by more than double the topline results (Figure 148).
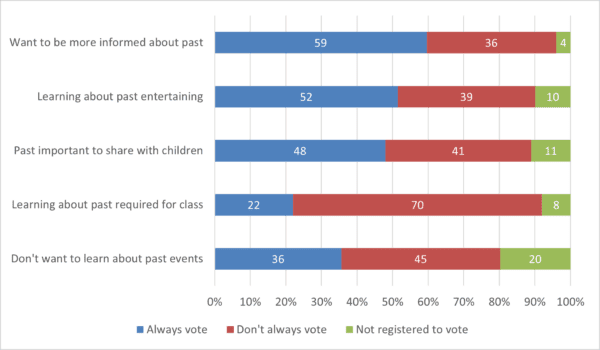 Figure 148: Respondents’ voting habits in elections as a function of motives to learn history. (CE2 x S6)
Based on these correlations between civic engagement and attitudes toward learning history, one could make the argument that a general curiosity about the past is a net positive. But other reasons for finding interest in history had an ambiguous or even negative effect. Moreover, in the case of voting, other factors appear to weigh much more heavily on people’s decisions to cast ballots or not. Unsurprisingly, age was a major determinant, as those in the 65+ bracket outpaced younger voters by at least 20 points (Figure 149). A similar effect is seen in the voting patterns of college graduates versus their nondegreed peers (Figure 150), and the comparatively low suffrage rates and correspondingly high unregistered number for Hispanics is equally striking (Figure 151). And while Democrats and Republicans reported very similar voting patterns, independents were much less reliable, while the habits of those with no party preference were downright abysmal (Figure 152). We might have always suspected it, but apathy truly is the kill switch to an engaged citizenry.
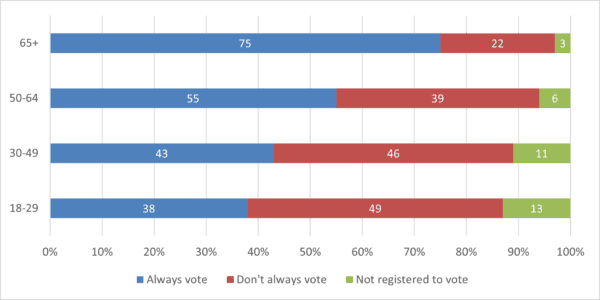 Figure 149: By age group: Respondents’ voting habits in elections. (CE2
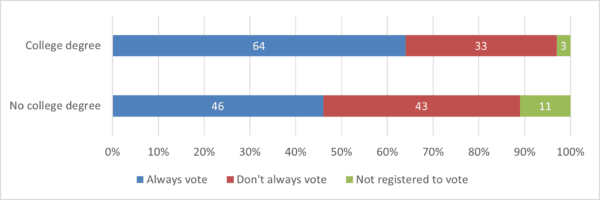 Figure 150: By education level: Respondents’ voting habits in elections. (CE2)
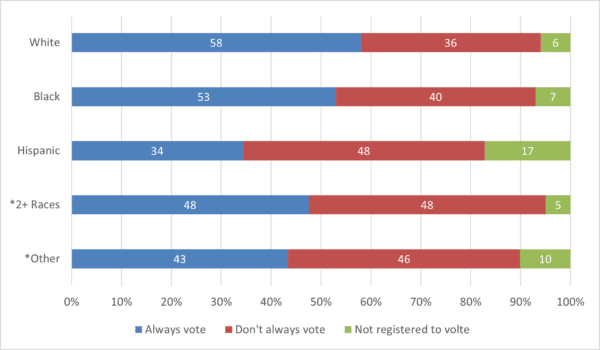 Figure 151: By race/ethnicity: Respondents’ voting habits in elections. *Fewer than 100 responses. (CE2)
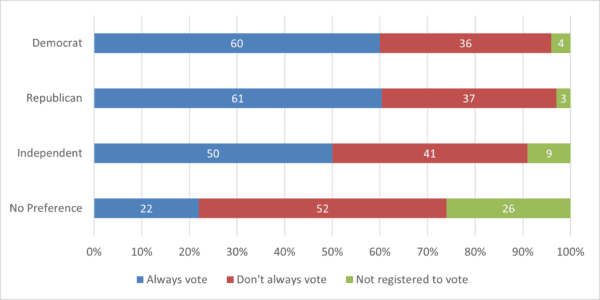 Figure 152: By political party: Respondents’ voting habits in elections. (CE2)
A final cross-tabulation adds perspective to the relationship between civic engagement and attitudes toward the past. It involves correlating community involvement with a belief in whether our knowledge of history should change (see Section 9 for a discussion of the latter). In these comparisons, we see that those harboring a malleable understanding of past events are more apt to be civically engaged, registering involvement figures that are 8 to 13 points higher than their fixed-knowledge counterparts. This is true of community problem-solving (Figure 153), volunteerism (Figure 154), contact with elected officials (Figure 155), and voting habits (Figure 156). Such findings are suggestive of a correlation between a belief in the variable nature of historical knowledge and in one’s own ability to change the world, keeping in mind the bivariate nature of these relationships.
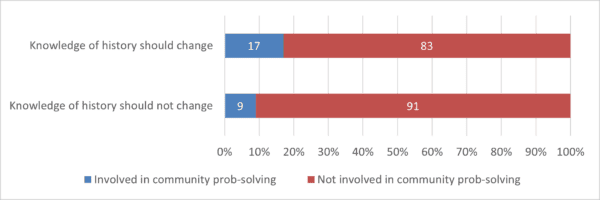 Figure 153: Respondents’ involvement in community problem-solving as a function of a changing or fixed view on historical knowledge. (CE1 x HR1)
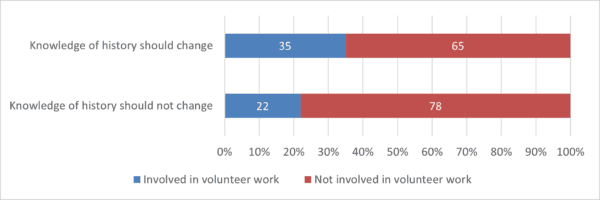 Figure 154: Respondents’ involvement in volunteer work as a function of a changing or fixed view on historical knowledge. (CE3 x HR1)
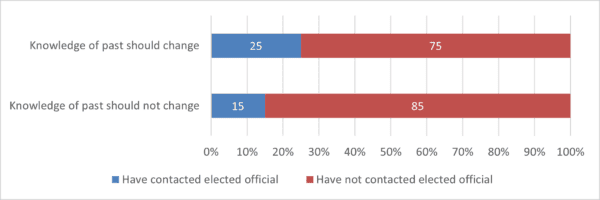 Figure 155: Respondents’ contact with an elected official to express an opinion or concern as a function of a changing or fixed view on historical knowledge. (CE4 x HR1)
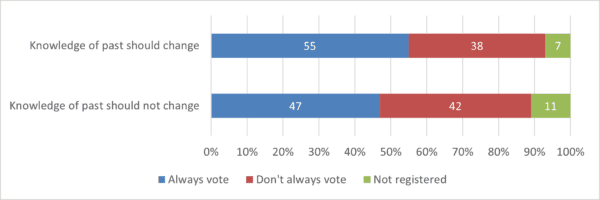 Figure 156: Respondents’ voting habits as a function of a changing or fixed view on historical knowledge. (CE2 x HR1)
Challenges and opportunities: The results of this section are a bit mixed, depending on one’s perspective. If one’s goal is to limit citizens’ participation in society, as a current raft of state-sponsored voter suppression legislation seeks to do, then a few options readily present themselves. Meddling in people’s historical outlooks, which is the apparent objective of restrictions on the teaching of so-called “divisive concepts,” would appear to make little difference, since there are only minor correlations between historical outlooks and civic engagement. However, if people’s interests in the past are so completely short-circuited that they stop caring altogether, our findings show that the effects on public action can be more profound. Less pessimistically, getting citizens a college education and ensuring they live into their senior years are two indirect but seemingly reliable ways to promote civic engagement. The fact that history is a cornerstone to many undergraduate programs is thus a reason for optimism.
← Previous section Next section →