History and the Military
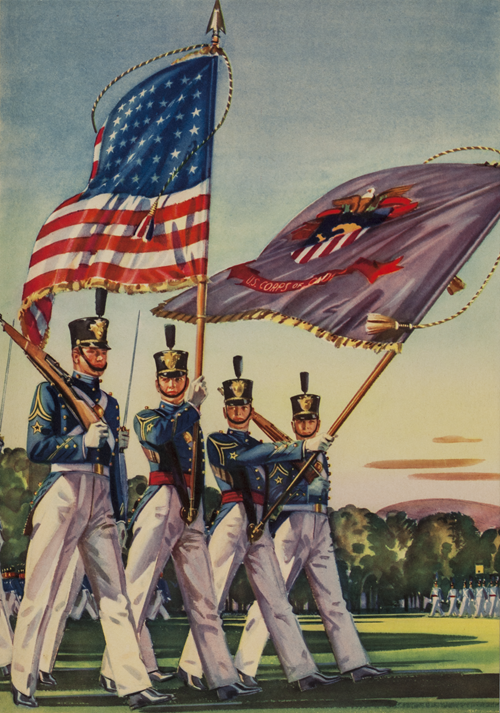
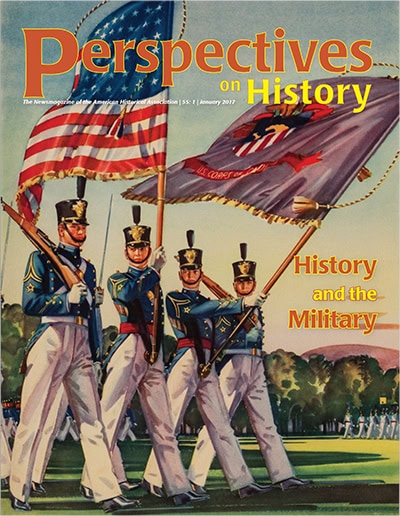
Today, student military experience features prominently in conversations about college access, curriculum, and affordability. But many historians might not have considered the role of critical thinking in military training or in the ways student veterans are coming to shape classroom discussions. As two of our contributors—one a current officer, the other a veteran—argue, military service necessarily entails critical thinking, and the study of history can reinforce it. Image: artist unknown, “The Colors: Four Years Pass in Final Review,” US Army Center of Military History
Staff