Each year the AHA, as the leading venue for job advertisements for history PhDs, reports data on the contours of the job market for historians. This year, we’ve included a follow-up survey of advertisers to obtain quantitative and qualitative information on search outcomes—picking up where the ads leave off.
Since the recession, the number of jobs advertised with the AHA at careers.historians.org has typically dropped while the applicant pool has grown. But the newest data on the academic job market in history signal a slightly different picture. In 2015–16, the number of ads once more edged down slightly, but the average number of applications for some jobs appeared to shrink as well.
-600x406.jpg)
Figure 1
Figure 1 charts long-term trends in the job market. In the 2015–16 academic year, the AHA received 572 job advertisements for full-time positions, including tenure-track jobs, non-tenure-track jobs, and term-limited fellowships, as well as positions beyond the professoriate. This marked a 2.6 percent drop from the year before and the fourth consecutive year in which the number of advertisements posted a decline.
On the other side of the job market, a new federal tabulation of PhDs conferred in the 2014–15 academic year reported a small (3.1 percent) decrease in the number of history degrees awarded. Even with the decrease, however, the number of new history doctorates (1,145) was the second largest in 40 years.
As in years past, the largest number of history PhDs went to specialists in the history of North America (413), but as a share of all history PhDs, the specialty fell for the fourth consecutive year—from 40 percent of history PhDs in 2010–11 to 36 percent in the most recent year. The number and share of PhDs conferred in European history fell over the same span—from 224 to 198, and from 21 percent to 17 percent of all history doctoral degrees.
Available data indicate that PhDs earned by specialists in the history of Africa, Asia, Latin America, and the Middle East have all grown in the most recent five years. Doctorates awarded in Asian history, for instance, increased from 68 to 89. Degrees awarded in the field of Middle Eastern history were not tabulated until the 2007–08 academic year (when 45 were conferred), but as of 2014–15, the number had grown to 82. Among the other specialties, 30 doctorates were awarded in African history and 63 in Latin American history.
The Jobs

Figure 2
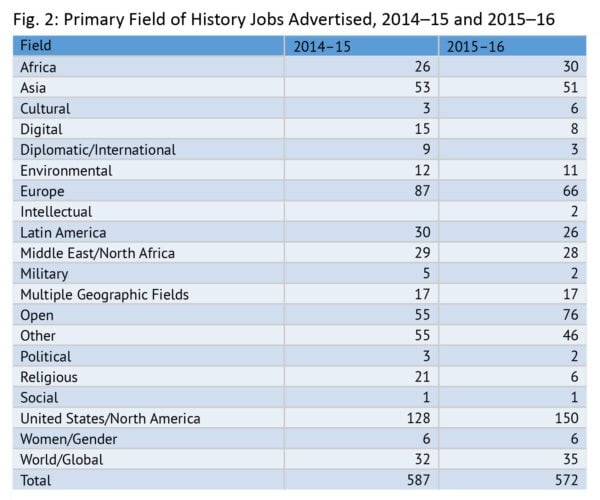
As seen in figure 2, the largest number of job openings (within and beyond the professoriate) posted with the AHA was for specialists in US history, with 150 of 572 openings listing the subject as their primary field. This marked a modest increase for US history openings—from 128 the year before.
In contrast, the second-largest geographic subject area—European history—fell substantially from the prior year: from 87 openings in the 2014–15 academic year to 66. The number of listings for Asian and Latin American history also fell, but by a much smaller number (from 53 to 51 in Asian history and from 30 to 26 in the history of Latin America).
Among academic job listings with a primary focus on a topical specialty or skill, the number of listings also contracted. The largest declines occurred among postings for specialists in the histories of religion and diplomacy (down 71 percent and 67 percent, respectively). Ads listing digital history as the primary job requirement also fell 47 percent (from 15 to 8), even as the number of ads mentioning such skills as desirable rose to over 12 percent of the listed openings (from 5.5 percent of the jobs advertised the previous year).
Listings for positions entirely outside the professoriate—that is, those for nonprofessorial and nonfellowship positions—are part of an important recent change. Reflecting the Association’s ongoing efforts to promote career diversity for history PhDs, the job advertisements included a growing number of positions in public history and nonteaching positions in academia (from 14 the previous year to 66, rivaling the numbers of academic listings in some subfields).
It’s important to keep in mind that it is the advertisers who assign field specializations. In the aggregate, academic jobs for history PhDs appear more likely than nonacademic jobs to include defined geographical or topical fields.
The Applicant Pool

Figure 3
Since an indeterminate number of PhDs from previous years continue to apply for jobs, the number of degrees conferred in each field (fig. 3) reflects a snapshot of a particular point in time. To measure the competition for advertised positions, AHA staff sent a follow-up survey to all 572 of last year’s advertisers, asking for basic information about the number of applications and the applicants hired. The results highlight the heavy competition for each job posted.
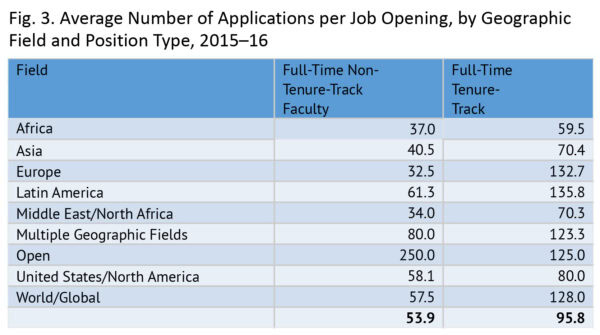
The 231 advertisers who responded to the survey reported an average of 81.8 applications per position, with an average of 95.8 applicants per opening specifically for entry-level, full-time tenure-track appointments.
Among these entry-level tenure-track openings, positions in African history received the smallest average number of applications—59.5 per opening—as compared to 135.8 for openings in Latin American history and 132.7 for European history searches. A handful of respondents for the European history positions offered particularly grim assessments of the academic job market, with one noting, “Nothing broke my heart more than the initial vetting of application files. We received nearly 300 files, and the vast majority were from well-qualified people. I cannot imagine how disheartening it must be for young scholars vying for a tenure-track position in the present market.”
Curiously, entry-level job openings focused on US/North American history received a relatively small average number of applications (80 per full-time tenure-track opening). This marked a substantial drop from the average in the previous survey (conducted among advertisers from the 2010–11 academic year), when nearly 100 applications were received for each entry-level opening in US history.
While last year’s average still indicates considerable competition for each opening, one advertiser for a US history position observed, “We had fewer candidates than anticipated,” but added, “we were very happy with the candidate to whom we made an offer and very happy that the candidate accepted.”
The average number of applications for US history specialists in nonprofessorial positions advertised with the AHA (such as managerial and public history positions both inside and outside academia) had larger pools of candidates, reporting an average of 112.6 applicants per opening. Though a small subset, positions not requiring the PhD attracted the largest applicant pools, possibly skewing the average number higher.
Recent surveys conducted for the AHA and the Humanities Indicators show a persistently strong pull toward academic employment for PhDs in history and the humanities at large. Relative to other fields, humanities PhDs are twice as likely to take positions in postsecondary teaching, even as academic job listings for PhDs across the humanities have fallen more than 31 percent since the recession.
The Hires
Almost 90 percent of the faculty positions advertised had been filled by the time of the survey. Among the 25 positions left unfilled, more than half of the respondents indicated that the search failed because the selected candidate or candidates did not accept the offer. Only three positions remained unfilled because the budget line was canceled or still pending funding.
Most of the respondents who offered an opinion on the subject indicated that their administrations had been quite supportive in the search, and two had even allowed the department to hire two applicants instead of one, to take advantage of the excellent pool of candidates.
Among the faculty members hired to entry-level appointments, 9 percent had not yet earned the PhD, which was up modestly from the 2010–11 survey (from 6 percent) but substantially below the 14 percent share in the 1995–96 survey of advertisers.
A slightly larger share of the new junior hires (11 percent) had earned their PhD more than five years earlier. This share has been trending upward in the 20 years of advertiser surveys. Two decades ago, just 5 percent of the new hires at this level were more than five years from their doctorates.
Taken as a whole, the data point to continuing challenges for recent PhDs seeking academic appointments, with dozens of applicants competing for every entry-level job and unpredictable fluctuations in field-specific openings from year to year. Whether the 2015–16 AHA data herald the beginning of a new trend will only become clear in years to come.
This work is licensed under a Creative Commons Attribution-NonCommercial-NoDerivatives 4.0 International License. Attribution must provide author name, article title, Perspectives on History, date of publication, and a link to this page. This license applies only to the article, not to text or images used here by permission.


