NRC Study Offers Wealth of Data on PhD Programs
A massive new study by the National Research Council (NRC) provides a wealth of data on Ph.D. programs in the United States, including departmental rankings and comparative cross-disciplinary information. For the history profession, however, the study's utility is undermined by the kind of deficiencies one might expect in a report that uses common measures for programs that range from art history to mechanical engineering.
 The NRC study, Research-Doctorate Programs in the United States: Continuity and Change, is based on data collected up to 1993. It offers two sets of measures for Ph.D.-granting programs: quality rankings of programs by those in the field and quantitative measures of specific data such as number of faculty and students, time required to complete doctoral degree, and the "level of faculty research and scholarship," as measured by publications, citations, and grants.1
"This study provides invaluable statistical data on the character of graduate education in this country across the disciplines," according to AHA Council member Douglas Greenberg. "For historians, it offers a snapshot of graduate programs that should be valuable to graduate deans, undergraduate faculty advisers, and potential graduate students, as well as to graduate faculty members." Greenberg is president and director of the Chicago Historical Society and an ex officio member of the committee that put the study together.
The wealth of objective measures offered by the NRC study offer valuable data for interdepartmental and cross-disciplinary comparisons. History Ph.D. programs remain among the largest of the various disciplines, with an average of almost 30 faculty members per department. According to the NRC, only departments of mathematics, English, and a few of the hard sciences have a larger average number of faculty per department. History Ph.D. programs are also among those with the most faculty in the top ranks—almost 55 percent of faculty at Ph.D.-granting history departments are at the full professor rank. This is the highest proportion of senior faculty among the social sciences, but it's slightly below the percentages in humanities programs such as classics, philosophy, and religion.
The largest history faculty in 1993 was at UCLA, with 89 department members. The history departments at Johns Hopkins and the City University of New York's Graduate School and University Center had the highest percentage of full professors on faculty with 91 percent.
And history is second among the social sciences in the average number of graduate students per department. Psychology averages over 100 graduate students per department, while history averages 76 students. When the humanities are included in the comparison, English programs (with 85 students per department) and religion (with 83) have a larger average.
Ranking History Ph.D. Programs
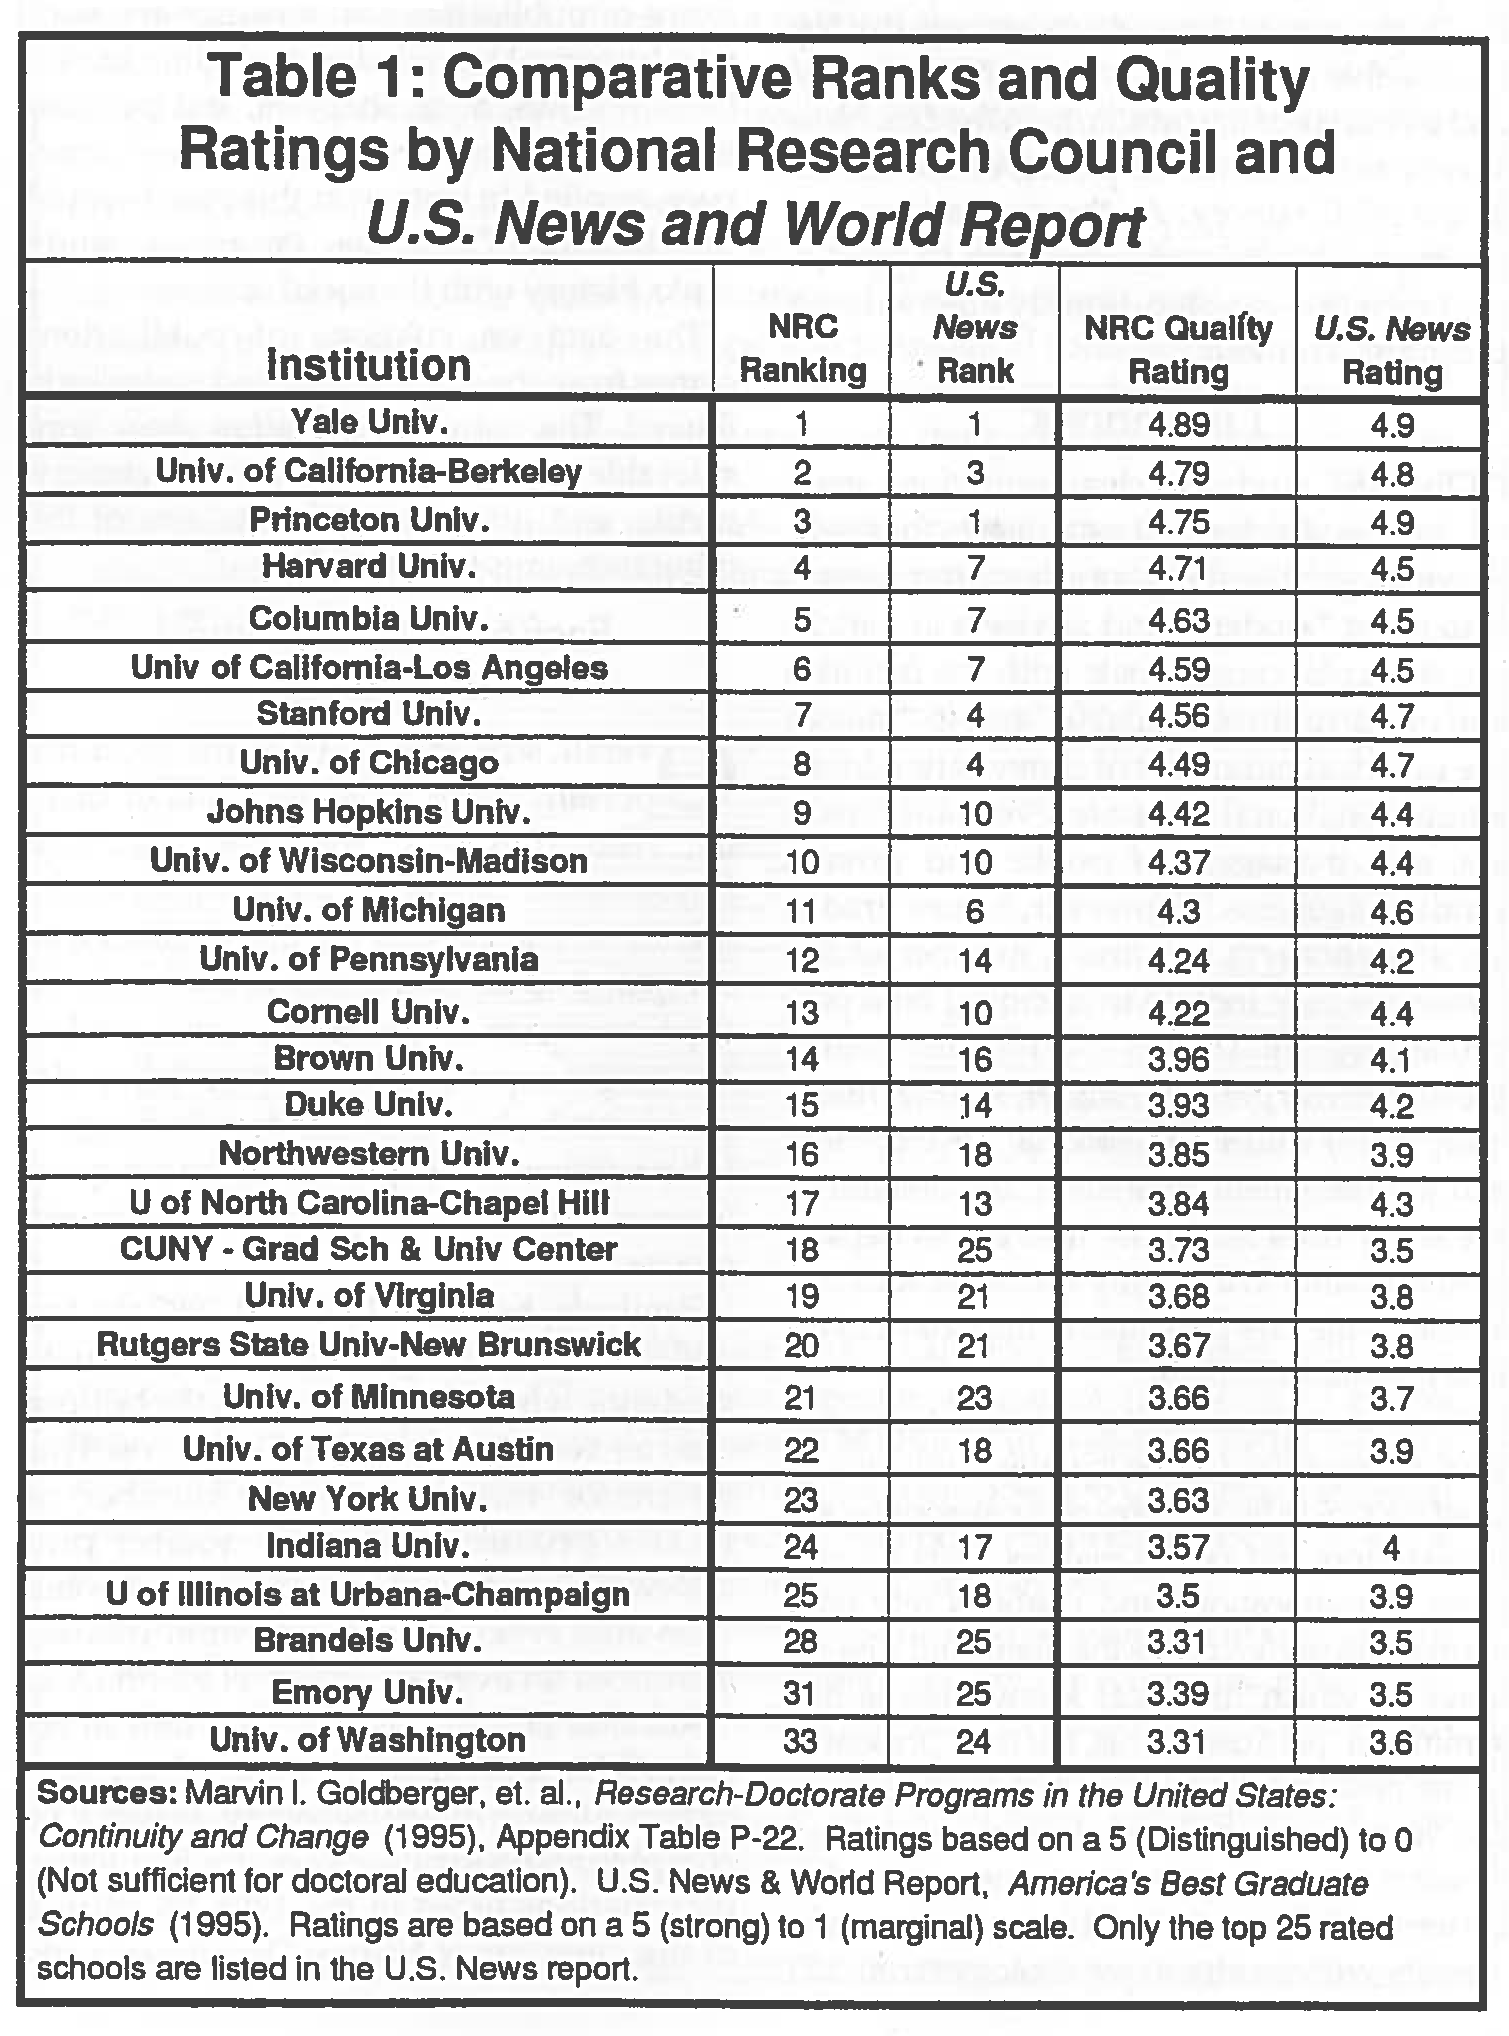
The NRC study also incorporates a survey of 446 graduate school faculty in the field, who ranked Yale's history department first in both "scholarly quality of program," and "program effectiveness in educating research scholars and scientists." However, the departments at Berkeley and Princeton ranked within the statistical mean for first. Forty-three percent of history Ph.D. programs were ranked between "distinguished" and "strong," Only 5 percent were ranked as "not sufficient for doctoral education." Fifty percent of the history Ph.D. programs were ranked as "extremely" or "reasonably" effective in the preparation of graduate students, while 9 percent were ranked as "not effective," Greenberg advises, however, that the survey data "should not be used as a simple-minded ranking of graduate programs. That was not the aim of the survey, and the data are actually not very useful if employed for that purpose."
In fact, the often maligned results in the annual U.S. News and World Report survey closely correlate to the NRC's findings. A. Table 1 demonstrates, all but three of the top twenty-five programs in the 1995 U.S. News survey of Ph.D. programs showed up among the top twenty-five departments in the NRC survey, and all but six of the programs in the U.S. News survey were within 0.3 points of the results in the NRC survey. As the similarities and divergences in the two rankings suggest, a tiny variation can significantly alter where a program is ranked.
Limitations
The NRC study has clear limitations, even by the standards it establishes for itself. According to the study's authors, its purpose is to assist "students and advisers in matching students' career goals with the facilities and opportunities available" and to "inform the practical judgment of university administrators, national and state level policy makers, and managers of public and private funding agencies." However, future graduate students will not find a number of the measures they look to in deciding on a particular program. There is little measurement of the support for graduate students, either financially or for future professional development and job placement. Moreover, the breadth of the study does not allow it to assess departmental quality in the many specializations and subfields that are particularly important to future graduate students.
Weaknesses in some of the NRC data are particularly troubling given that the study may be used for cross-disciplinary comparisons by administrators and policy makers. Data on patterns of publications and citations rely on a source that undercounts the many and diverse ways in which historical knowledge is disseminated. Because of this, the data presented in the NRC report implies that historians are the least productive among social science scholars, averaging less than one publication between 1988 and 1992. This compares unfavorably with faculty in psychology (with 3.71 average publications), sociology (with 2.14 average publications), and even political science (with 1.46). These numbers are in stark contrast with another survey, also conducted by the NRC, which ranks history among the humanities. That study indicates an average of almost 3.3 publications per history Ph.D. between April 1992 and April 1993.2
The data for the study on Research-Doctorate Programs came from the Institute for Scientific Information (ISI) According to the study's authors, ISI data are valuable in regard to studies of the social sciences but are "considered of little value in the Arts and Humanities fields" because the ISI concentrates on papers in journals and monographs when assessing frequency of publication. This obviously ignores many forms of publication that advance and support historical knowledge, including books, book reviews, book chapters, and publications for wider audiences. ISI data are, however, applied to history in this case because the Research-Doctorate Programs study ranks history with the social sciences.
The data on citations of publications comes from the same source and is similarly flawed. The patterns of citation show considerable unevenness between departments, and little correlation to any of the other measures in the study.
Factors in Effectiveness and Quality
Overall, size appears to be the most important factor in assessments of quality, according to the NRC survey. Departments ranked in the top quarter for quality averaged 46.3 faculty members, as compared to an average of 29.59 faculty in departments in the bottom quarter. And as one might expect, the more prestigious departments had a much higher percentage of fun professors, 66.37 percent in the top quarter as compared to 54.6 percent in the lowest quarter.
Similarly, between 1988 and 1992 the top departments averaged over 151 graduate students, while departments in the bottom quarter averaged only 30.75 students. This difference tracked into the number of Ph.D.'s produced-the top quarter produced an average 53.39 Ph.D.'s between 1988 and 1992, while the bottom quarter produced an average of just 11.75 Ph.D.'s. Another correlation can be found in recent AHA surveys of the areas of specialization among those working toward or completing history degrees. By analyzing dissertations listed in the 1995-96 edition of the Directory of History Departments and Organizations, AHA staff found that departments ranked in the top quarter had a much wider range of field coverage than schools rated in the bottom quarter. Among the top-rated schools, topics were so evenly distributed that no more than 7.2 percent of students appeared to be working in a particular area and time period. By contrast, almost 32 percent of students at departments rated in the bottom quarter were clustered in the most popular area and time (20th-century United States).3
Disciplinary Changes since 1982
A comparison of the data contained in the new NRC report with data in a similar NRC survey performed in 1983 shows significant changes in the size of various history programs and in the patterns of Ph.D. production. Over the past 10 years, the size of the faculties in history Ph.D. programs fell by an average just over 3.2 faculty per department. At the same time, the number of Ph.D. recipients dropped significantly, from an average of 45.51 graduates per department to an average of 27.3—a decline of almost 40 percent. The time to complete the Ph.D. has grown considerably in all disciplines; however, history outpaced the other disciplines in this category with a 32 percent increase from 9.2 years to 12.2 years from entry into graduate school to receipt of the Ph.D.
For More Information. Selected files and tables from Research-Doctorate Programs in the United States can be found on the World Wide Web at http://www.nap.edu/online/researchdoc/. To encourage additional and deeper scholarly analysis of the data, the NRC is preparing a CD-ROM with a much richer array of data. To purchase copies of the report, contact the National Academy of Sciences Press at 1-800-624-6242.
Notes
1. Marvin L. Goldberger, et al., Research-Doctorate Programs in the United States: Continuity and Change (1995).
2 Humanities Doctorates in the United States 1993 (1996), p. 64. This is supported by recent information on patterns of publication, which indicates history titles are among the largest nonfiction categories. "Ups and Downs: Output and Prices," Publishers Weekly, March 29, 1995, pp. 529-531.
3. Ph.D. dissertators tabulated from dissertation titles submitted to the Directory of History Departments and Organizations, 1995-96. Data supplemented by supporting data from Doctoral Dissertations in Progress, vols. 17 and 18. For more information on this survey, see Robert Townsend, "History Salaries Show Continued Improvements—for Some," Perspectives, March 1996.
Tags:

This work is licensed under a Creative Commons Attribution-NonCommercial-NoDerivatives 4.0 International License. Attribution must provide author name, article title, Perspectives on History, date of publication, and a link to this page. This license applies only to the article, not to text or images used here by permission.
The American Historical Association welcomes comments in the discussion area below, at AHA Communities, and in letters to the editor. Please read our commenting and letters policy before submitting.
Comment
Please read our commenting and letters policy before submitting.


