News
New Data Show Large Drop in History Bachelor's Degrees
New data from the National Center for Education Statistics show a dramatic decline in the number of bachelor’s degrees in history awarded in 2014, the most recent year available. The number of history BAs and BSs completed in the United States fell for the third time in four years, this time by 9.1 percent from the previous year, from 34,360 to 31,233.1 This is the largest year-to-year change for undergraduate history degrees since a 9.8 percent increase in 1992.
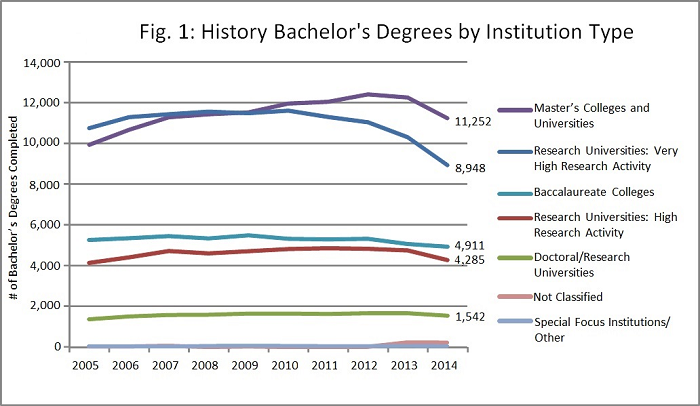
Unlike the 2.8 percent decline in 2013, the 2014 change affected every type of bachelor’s-granting institution across the Carnegie classification system.2 The data show that around 1,270 institutions in the United States grant bachelor’s degrees in history. Among the main categories of these institutions, the one-year decline was steepest at institutions classified as “very high research” universities, where the number fell by 13.3 percent (fig. 1). At baccalaureate colleges, the decline was 2.6 percent.
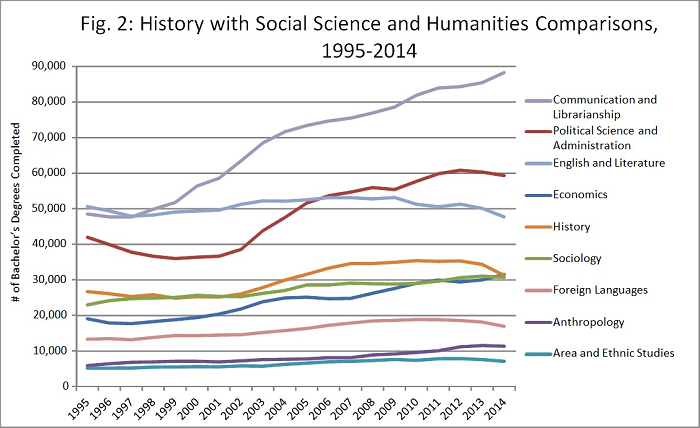
At the same time, the total number of people earning any bachelor’s degree rose more slowly in 2014 than it had for the preceding few years, going up just 1.6 percent over 2013. Despite this minimal growth, the history bachelor’s continued to shrink as a proportion of all US bachelor’s degrees awarded. While 2.2 percent of these were history degrees in 2007, only 1.7 percent of them were in history in 2014. As reference points, the top five discipline areas for the most recent year were business and management (19.5 percent of all bachelor’s degrees); life sciences excluding agriculture, biological, and medical sciences (9.7 percent); psychology (6.3 percent); non-science education (6.2 percent); and biological sciences (5.8 percent). Figure 2 compares history with several other disciplines in the social sciences and humanities. Economics degrees have been growing steadily, and have now surpassed history. English and literature BAs fell by 4.8 percent, and now constitute 2.5 percent of all bachelor’s degrees. Another field related to history, social science education (not pictured here because of the scale), also lost ground; bachelor’s degrees in this area fell 14.5 percent, from 1,335 to 1,141. Social science education includes history, geography, and psychology teacher-education degrees, but social studies education degrees are classified separately.
 These national data on degree completions are lagging indicators of overall history majors, meaning they reflect past conditions: the 2014 completions are the cumulative results of enrollments and student achievement typically over the past four to five years.3 Students who completed 2014 bachelor’s degrees in most cases would have begun their college careers four years earlier, in the fall of 2010; most would have made their decision about a course of study by 2011. This means that the data could be interpreted in several ways. In 2010, the world was still in the midst of a deep economic recession. We could imagine that there might have been a rise in history majors since then. Or it is conceivable that the 2014 change was a one-year drop that will not repeat. While either of these scenarios might be true at a particular institution, such optimism regarding a nationwide trend is likely unwarranted.4
Data self-reported by departments to the AHA for its Directory of History Departments, Historical Organizations, and Historians (the Directory), as well as conversations with department chairs and other anecdotal information, suggest that neither of those optimistic predictions will be borne out. Rather, the available information suggests that the 2014 completion data is more likely than not one step in a downward trend that will play out unevenly across undergraduate programs over the next two to three years. At the national level, it seems likely that the size of the history major at many large universities in particular will then stabilize at levels significantly lower than in the pre-2010 period.
The AHA’s Directory includes close to 500 US departments for which we have uninterrupted data since the 2009–10 academic year. Although departments do not always update their directory information annually, the Directory generally corroborates the trend in the size of history programs over the past few years. The aggregate number of bachelor’s-level majors reported in the 2014–15 Directory is 19 percent lower than in the 2009–10 listings. The past two years of reports, which may encompass the class of 2017 and the class of 2018, account for more of the change than the previous three years—i.e., the students who made up the class of 2014.
Who Is the Class of 2014?
The proportion of women and minorities among those earning history bachelor’s degrees changed only slightly between 2013 and 2014 relative to the changes in the size of the group as a whole. There are some patterns in the demographic data worth pointing out, however. The year 2014 was the first in which white men and women together made up less than three quarters (74.4 percent) of those who completed a bachelor’s degree in history. Relative to the 2013 data, the number of white men declined by roughly the average rate (9.5 percent), and that of white women fell somewhat faster, by 10.8 percent. Mainly as a result of this differential decline in the largest demographic groups, 39.8 percent of the 2014 history graduates were women, down slightly from 40.2 percent in 2013. The ratio of male to female history graduates has remained fairly close to 3:2 since at least 2005. Across all degree fields, women earned 57.2 percent of all 2014 bachelor’s degrees. Even as women make up the majority of American college students, men continue to be the majority of students who choose undergraduate history majors.
 The biggest change for any demographic group in the 2014 data was a more than 22 percent decline in the small number of history graduates who were women of Asian or Pacific Islander ancestry. Four hundred ninety-eight of these students finished history bachelor’s degrees in 2013, while only 386 did so in 2014. Together with the 11.7 percent drop among men in this group, Asian and Pacific Islanders were left at just 3 percent of the history total: they are underrepresented in the discipline relative to their presence in the US population as a whole (5.6 percent) and relative to their share of all 2014 bachelor’s degrees in the US (6.6 percent).5
The picture for black and Latino graduates in the 2014 numbers is more complicated. African Americans were still just 5.0 percent of those completing history degrees. Encouragingly, more black men earned a degree than in 2013 or previous years, with the number rising from 790 in 2013 to 829 in 2014 (4.9 percent). The number of black women fell 7.6 percent to 727 graduates. Over the past two years, there has been evidence that history programs are succeeding in attracting some of the growing number of Latinos who are going to college. Latinos made up 9.7 percent of history graduates in 2014, with the numbers of both men and women staying virtually unchanged despite the big drop overall—a less than 1 percent fall in both cases. The small number of visiting foreign students—those classified as “temporary residents”—has been very stable, around 260, for several years. Finally, again in 2014 between 6 and 7 percent of graduates were of “other or unknown race or ethnicity.”
The AHA continues to support history departments and instructors as they respond to changing student needs and institutional circumstances. The Tuning project, which has involved over 150 history departments to date, is one such effort to catalyze faculty-driven work on program curricula. The AHA also continues to work with historians on and off college campuses to communicate broadly the value of historical study. A subsequent piece in Perspectives will share ideas drawn from conversations with department chairs and other history faculty members about how to make sense of the broad changes described here, and discuss strategies to maintain and deepen student interest in the undergraduate history major.
Julia Brookins is special projects coordinator at the AHA.
Notes
1. Integrated Postsecondary Education Data System (IPEDS) Completions Survey, provisional release data for 2014 from National Center for Education Statistics (NCES) Data Sources, as reported in WebCASPAR from the National Science Foundation, https://ncsesdata.nsf.gov/webcaspar/.
2. Allen Mikaelian, “Drilling Down into the Latest Undergraduate Data: History Bachelors Decline, but Several Upward Trends Persist,” Perspectives on History, November 2014, http://historians.org/publications-and-directories/perspectives-on-history/november-2014/drilling-down-into-the-latest-undergraduate-data. For his take on this year’s data in an interactive format online, see Allen Mikaelian, “A Big Slide for the History BA?” November 20, 2015, at http://allenjaym.com/2015/11/big-slide-for-the-history-ba/.
3. By contrast, a leading indicator is one that correlates with future events or trends. For gauging the health of postsecondary history education in the coming years, for example, we might want to know about total enrollments in introductory history courses this year, or college admissions of students who express an interest in studying history in the future. While some programs might be collecting this sort of data, there is no national data set that gives us a more solid indication of trends in collegiate history specializations.
4. It is worth noting that the completion data reflect several factors: not only the initial appeal of the history major to new college students, but also the numbers of students who transfer into or out of history either from other institutions or other programs at the same institution, as well as the rate at which students are successfully completing their programs of study. I have seen nothing to suggest that this single-year drop is due to a sudden change in the rates of transfer, time-to-degree, or attrition from history programs.
5. Asians make up 5.4 percent of the US population, and Native Hawaiians and Pacific Islanders 0.2 percent. Source: 2014 data from the US Census Bureau, QuickFacts, http://www.census.gov/quickfacts/table/PST045215/00.

This work is licensed under a Creative Commons Attribution-NonCommercial-NoDerivatives 4.0 International License. Attribution must provide author name, article title, Perspectives on History, date of publication, and a link to this page. This license applies only to the article, not to text or images used here by permission.
The American Historical Association welcomes comments in the discussion area below, at AHA Communities, and in letters to the editor. Please read our commenting and letters policy before submitting.
Tags: History News Resources for History Departments Graduate Education The History Major
Comment
Please read our commenting and letters policy before submitting.


