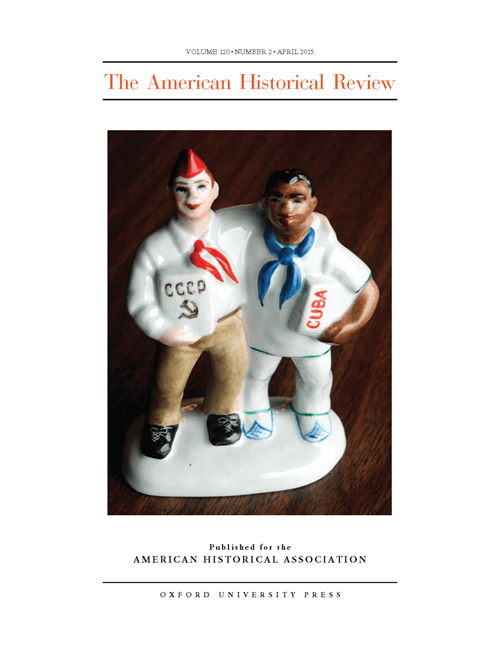
History as a Book Discipline
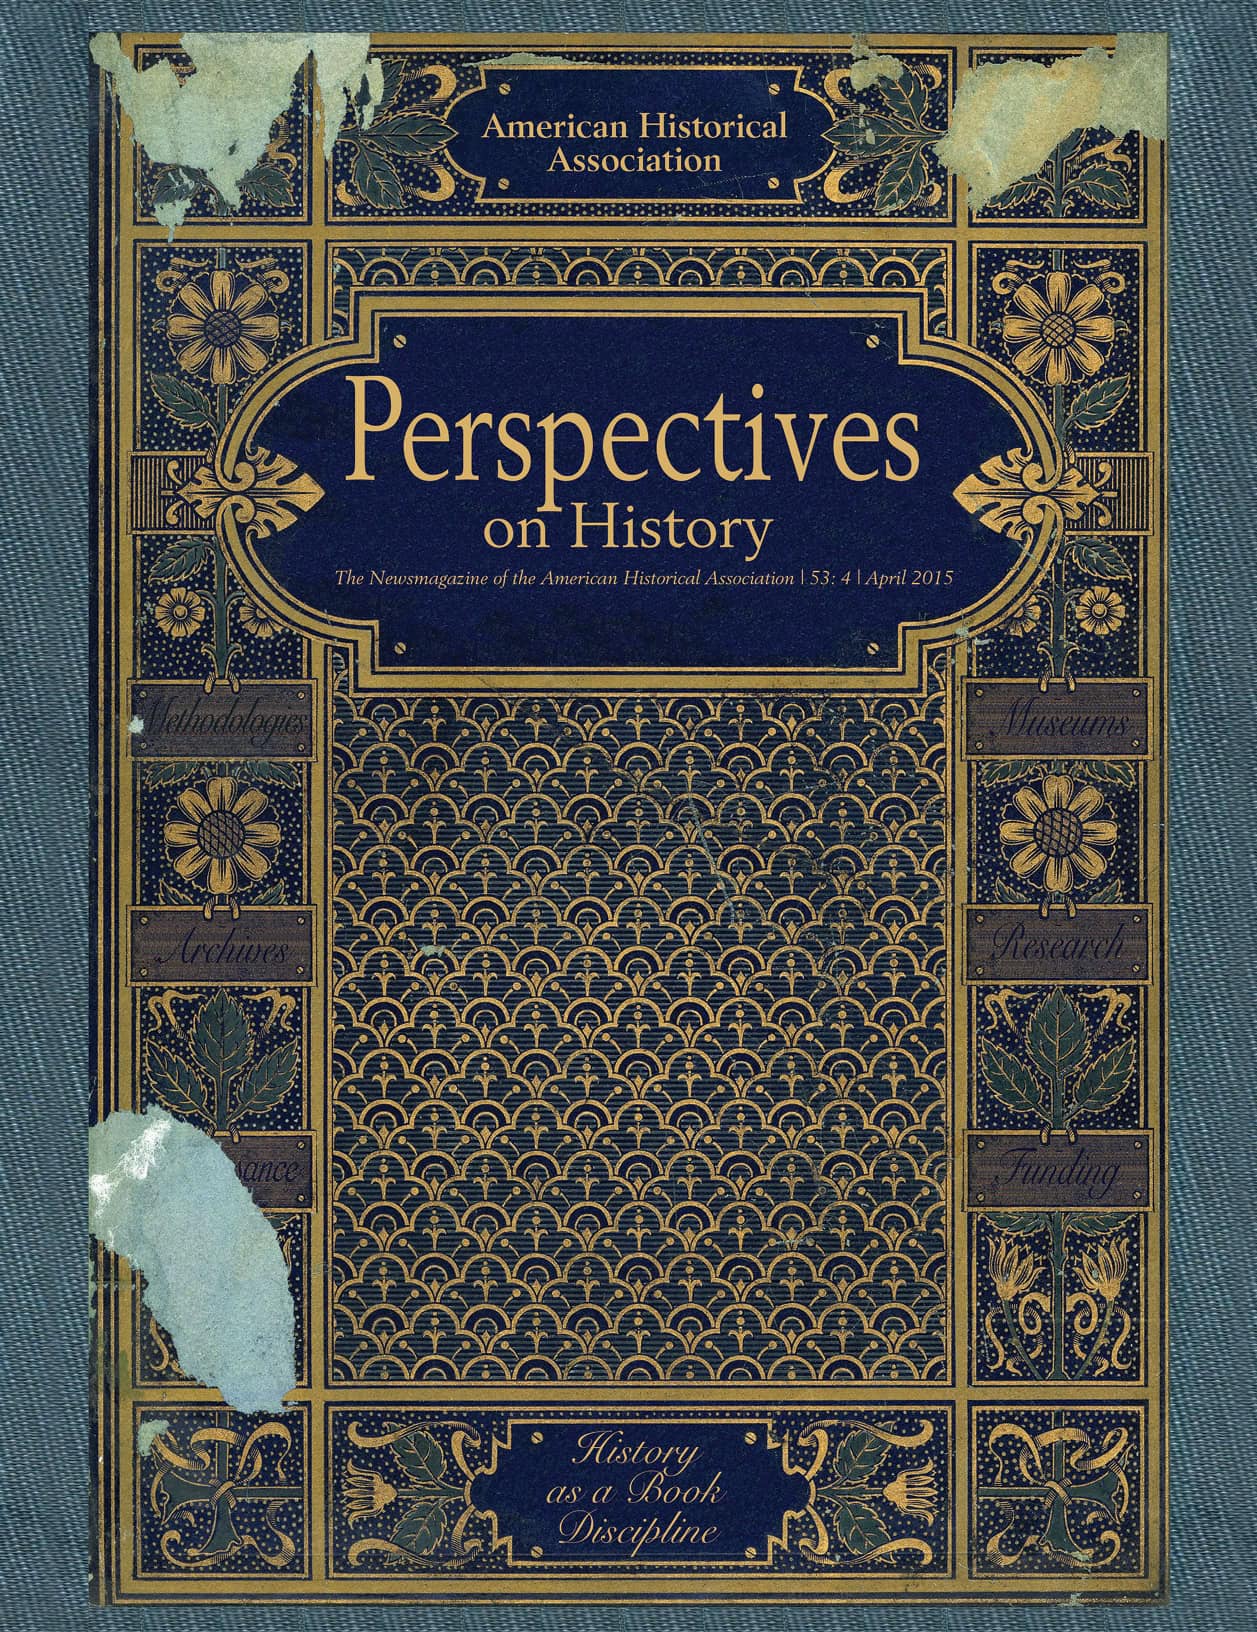
The cover of the book Comment Discerner Les Styles, a rare French title digitized by the John and Mable Ringling Museum of Art Library. This issue features the forum History as a Book Discipline, with articles by Lara Putnam, Claire Bond Potter, Fredrika J. Teute, and Timothy J. Gilfoyle. The forum is introduced by Seth Denbo, the AHA’s director of scholarly communication and digital initiatives. The Ringling Art Library digital image collection is on Flickr.
Staff