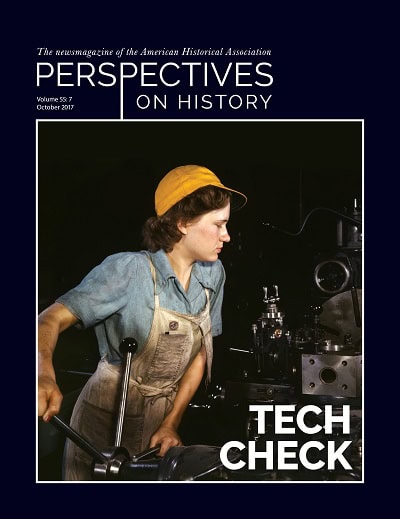
AHA Today

Mapping the Early Modern World

Using Google Maps in the Classroom

Julia M Gossard | Oct 23, 2017

While lecturing on Magellan’s famed voyage that circumnavigated the early modern world, I asked the student who had chosen to trace the voyage on a map if she had any further insights. Somewhat surprisingly she retorted, “Not historically, but it did take me a really long time to draw that line representing Magellan’s voyage. I can’t imagine having actually done it in the 16th century.” Her comment opened up an engaging (unplanned) discussion about the realities of sea travel, culture shock, and geography in the early modern world. As a result of the mapping assignment, students were thinking carefully about the challenges of early modern life, including how people traded and interacted with each other across the globe. 

The idea to assign a mapping project came to me in fall 2015 at the University of Texas at Austin when I named my survey course Global Early Modern Europe. Throughout the course, I emphasized that Europe between 1500 and 1800 was not an isolated continent. Instead, it was economically, politically, religiously, and ideologically connected to the wider early modern world. In particular, we studied the ways in which European states and people not only influenced the wider world but how indigenous populations in the Americas, rulers in Asia and Southeast Asia, slave traders in Africa, and merchants in the Middle East influenced Europe. To provide a visual representation of this, students plotted the transmission of goods, people, ideologies, and cultural inventions across the early modern globe.

Over the course of the semester, students were responsible for four entries to a Google map. Each entry was approximately 200 words and could be about a person, place, idea, commodity, or thing (such as a piece of art or a battle). Much like an identification term on an exam, these entries defined the subject, gave dates, and provided historical significance. Students were encouraged to draw lines between their entries that were related. Now complete, the map is a striking visual of how intertwined Europe was with the rest of the world during the early modern period. The entries proved to be a treasure trove for students who had intelligently and accurately crowd-sourced information in preparation for their midterm and final exams.

A mapping project such as this can address a number of learning objectives as well as challenges instructors face when teaching a survey history course. Instructors of survey courses in Western civ or world history frequently complain that their students lack a number of competencies that preclude their full understanding of the course’s content. Through this project, I was able to address my students’ lack of geographic knowledge, challenge their aversion to historical research projects, and build their digital literacy. The project addressed all three of these issues in a way that was accessible and exciting to students.

The first, and probably the most basic, problem my students had was a lack of geographic knowledge. Many generally knew where Europe was, but where exactly was the Holy Roman Empire? Or the Ottoman Empire? Although the Google Maps platform uses modern-day political boundaries, you can easily change the default setting to a topography map. Although none of my students did it, in future mapping projects I will encourage them to draw in the changing political boundaries of various kingdoms and empires to further emphasize the ebb and flow of geographic power. During the semester, my students started to see how geography was a causal factor in history. For instance, they recognized the important roles that waterways played both as conduits of exchange and as barriers. For many students, the enormity and danger of a voyage like Magellan’s took on a whole new meaning because they were able to chart it for themselves. They began to understand just how fundamental, difficult, and wide early exchange was.

Aside from providing a geographic understanding, this mapping project allowed students to become research collaborators. On the first day of class when I mentioned there would be a research project, many students looked unhappy. But when I explained to them it was going to be a digital mapping project their spirits lifted. About 75 percent of my students were non-humanities majors and were more familiar with visual and tactile presentations than auditory ones. With the map’s functionality, presentation style, and the autonomy students had in selecting the map’s content, the project spoke very clearly to many students’ desires to create. Although this project had all the same components of a research paper—presenting a solid thesis, supporting that thesis with primary source evidence, and writing in clear and concise manner—the early modern map made students believe they were doing a different kind of research. They saw their map as a collaborative exhibit that was intended to present information to each other in a way that was accessible, student-centric, content-driven, and precise.

While they were honing their research skills, they were also learning important lessons about digital and media literacy. I encouraged students to use digital sources, but taught them about source evaluation, bias, and legitimacy (see worksheet below). They developed strategies to filter out incorrect or biased information and prioritize scholarly information. Similarly, the mapping project afforded students a number of skills including the ability to work collaboratively on projects. They were able to master the Google suite of services, which sounds like a small skill but can be extremely valuable. It was astonishing how many students were unable to use Google Docs, Google Excel, and Google Maps prior to this project. These students now have these tools in their digital toolbox.

Even though there are many GIS and mapping platforms available for classroom assignments, Google Maps is still one of the most accessible. It is free to sign up and use. Chances are, too, most students already have a Gmail account that can serve as their login for Google Maps. Sharing the map is simple and requires only a URL. Teachers can also customize privacy settings—allowing the map to be private or public—based on their preferences.

For instructors who are nervous about assigning a digital project, this is a great place to start. Google Maps is easy to navigate and learn, but creates a visually stunning and useful assignment. In addition to the instructions I’ve provided below, Google offers many articles and videos to help you set up your own map. As with any digital project, the instructor should set aside a good amount of time to play with the tool themselves before assigning it. Looking back at the map nearly two years later, it still stands as one of my favorite assignments. It inspired me to assign a digital project in every course, whether as another mapping project, a digital timeline, or a class Wiki.

Instructions: Mapping the Early Modern World

Sample Worksheet: The Historian’s Toolbox: Source Evaluation

This post first appeared on AHA Today.


Julia M Gossard is assistant professor of history and a distinguished assistant professor of honor’s education at Utah State University. She teaches undergraduate- and graduate-level courses on the history of early modern and modern Europe. A historian of 18th-century France, Julia is finishing her manuscript, Coercing Children, that examines children as important actors in social reform, state-building, and imperial projects across the early modern French world. She is active on Twitter. To learn more about her teaching, research, and experience in digital humanities, visit her website.


Tags: AHA Today Europe Global History Teaching with Digital History


Comment

Please read our commenting and letters policy before submitting.