Home
/ Issue Archive
/ May 2009
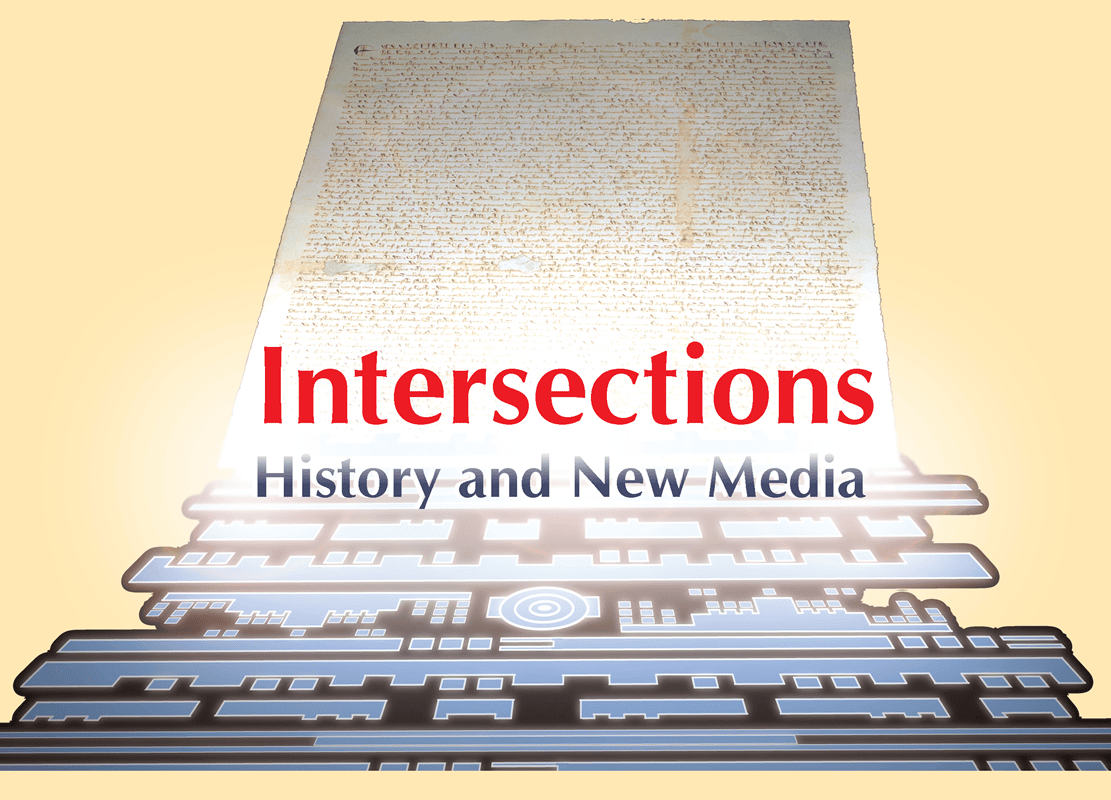
The cover art is by Chris Hale.
Staff
Pillarisetti Sudhir, editor David Darlington, associate editor Christian Hale, production manager and layout Liz Townsend, editorial assistant Vernon Horn, internet projects manager Elisabeth Grant, web content editor
May 1, 2009
Features
From the President
AHA Activities
AHA Annual Meeting
May 11, 2009
AHA Activities, Perspectives Daily
From the National Coalition for History
News
In Memoriam
May 20, 2009
In Memoriam, Perspectives Daily
May 27, 2009
News, Perspectives Daily
May 18, 2009
May 6, 2009
May 5, 2009
May 4, 2009