The number of students receiving bachelor’s degrees in history reached the highest level in almost 35 years in 2006–07, even as the number of new history PhDs conferred fell to its lowest level in more than 10 years.
According to the U.S. Department of Education, 34,446 bachelor’s degrees were conferred that year—3.9 percent more than in the previous calendar year, and the largest number awarded since 1973–74.1) In comparison, the total number of undergraduate degrees conferred by American colleges and universities increased by just 2.6 percent.

Figure 1
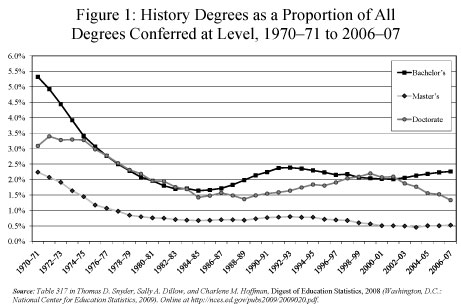
This marks the fifth consecutive year that the number of new history degrees grew faster than the rest of academia. As a result, history now accounts for 2.26 percent of all new undergraduate degrees conferred—up from a lowly 2.01 percent in 2001–02, but still well below the discipline’s glory days of the late 1960s and early 1970s, when history accounted for more than 5 percent of the degrees conferred (Figure 1).
At the master’s level, the number of new history degrees increased by 5.1 percent, from 2,992 to 3,144. This was in contrast to a much more modest increase of 1.8 percent among all fields. Still, relative to other fields, very few history master’s degrees are conferred—amounting to barely one-half of one percent of all MA degrees.
In contrast to the growth in degrees at the other levels, there was a 5.3 percent decrease in the number of new PhDs conferred in the discipline. History doctoral programs conferred 807 new history doctorates in the 2006–07 school year—the smallest number since 1993–94. The drop was in marked contrast to the total number of doctorates conferred, which increased 8.1 percent over the prior year.
This decline offers some positive news, however, given the continued disparities between new history PhDs and academic jobs in many fields of history, and signs of an imminent decline in the number of new jobs, as reported in the January 2009 issue of Perspectives on History.
Demographics of New Degree Recipients

Figure 2
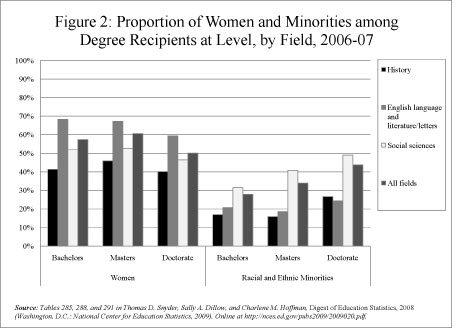
At every degree level, the field is demographically more homogenous than the rest of academia. Among the 2006–07 history degree recipients, women comprised 41.3 percent of the new bachelor’s degrees in history, 46.0 percent of the new master’s degrees, and 40.1 percent of the new doctoral degree recipients (Figure 2). This contrasts with female majorities among degree recipients in all fields, and even larger proportions in some of the other humanities fields (nearly 60 percent or more in English language and literature, for instance).
There is a similar disparity in the representation of racial and ethnic minorities, at all degree levels. In 2006–07, 16.9 percent of the bachelor’s, 15.9 percent of the master’s, and 26.6 percent of the new doctorates were members of a racial or ethnic minority. This is 64 percent lower than the average among degree recipients in all fields at the bachelor’s and doctoral levels, and less than half the representation at the master’s degree level.
Notes
- Thomas D. Snyder, Sally A. Dillow, and Charlene M. Hoffman, Digest of Education Statistics, 2008 (Washington, D.C.: National Center for Education Statistics, 2009 [↩]

