Out of the Closets, Into the Classrooms
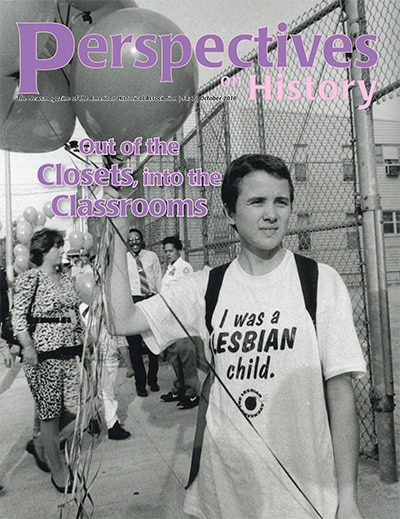
For this special issue devoted to teaching the history of sexuality and of LGBT people, three authors reflect on the topics’ place in the curriculum. As our authors show, addressing widespread student demands for this knowledge can allow faculty to rethink the way they teach survey courses. Historians can even look for ideas in K–12 frameworks of the sort California’s board of education just passed. As shown in our cover photograph, taken in 1991 at a protest by the Lesbian Avengers in New York City, teaching children about LGBT lives has been controversial for many years. Historians today, however, are leading the way to a more inclusive K–16 curriculum. Find out how inside. Photograph: Donna Binder.
Staff
.jpg)