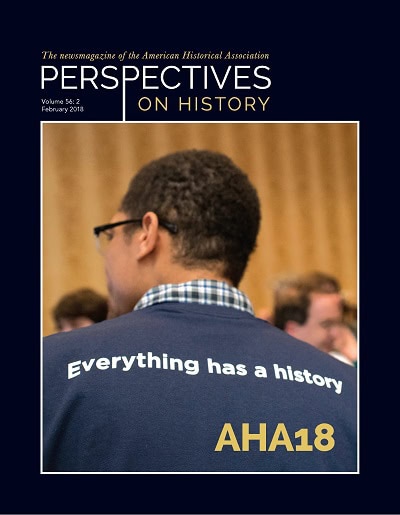
AHA18
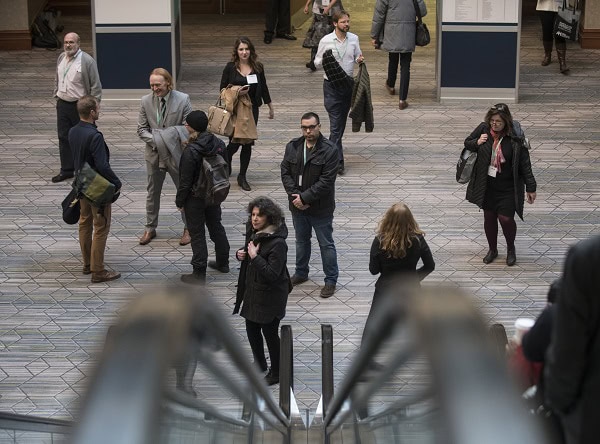
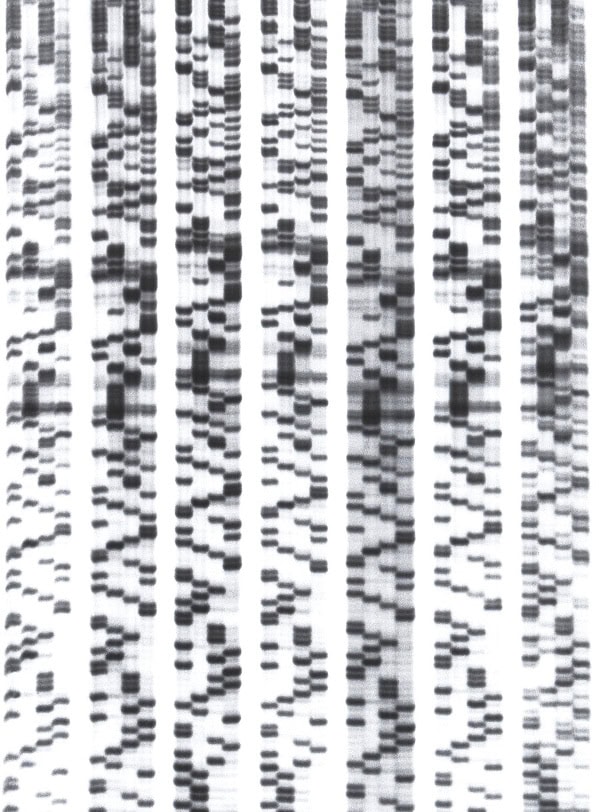
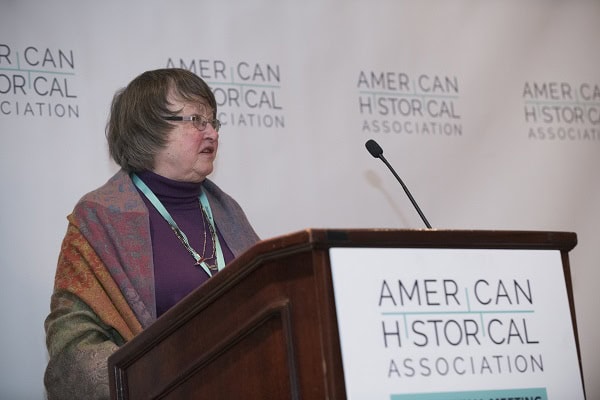
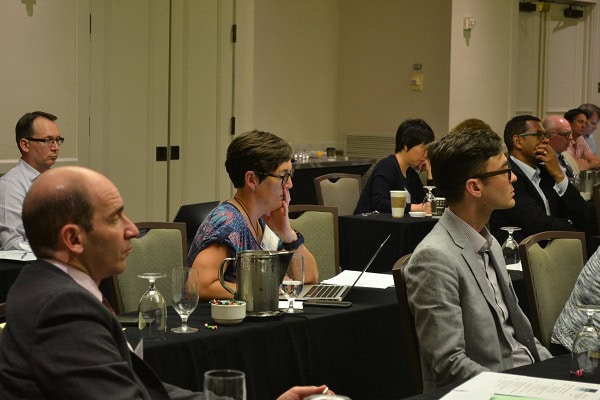
Every February issue of Perspectives is devoted to the AHA annual meeting just concluded. If you missed AHA18, take a look at Eladio Bobadilla’s recap, accompanied by our photographer Marc Monaghan’s signature imagery. If you were there but missed the sessions on genealogy and genetics, former AHA assistant editor Sadie Bergen assesses the issues underlying the discussions. Perspectives is proud to promote the work of these graduate students!
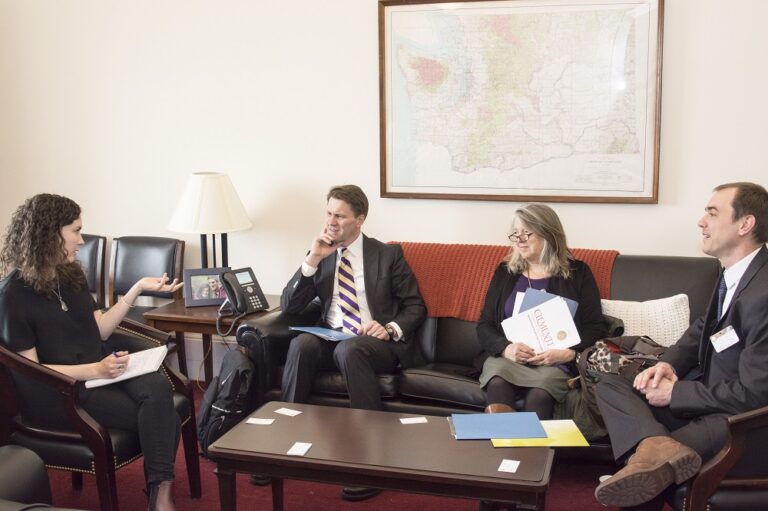
Photo: Marc Monaghan
Staff