News
History Takes a Tumble in Degrees Conferred: New Data Shows Field Lagging Behind
According to data published by the U.S. Department of Education in June, history degrees comprise a relatively small proportion of the total number of degrees conferred, and the field is significantly diminished from its standing 30 years ago.1
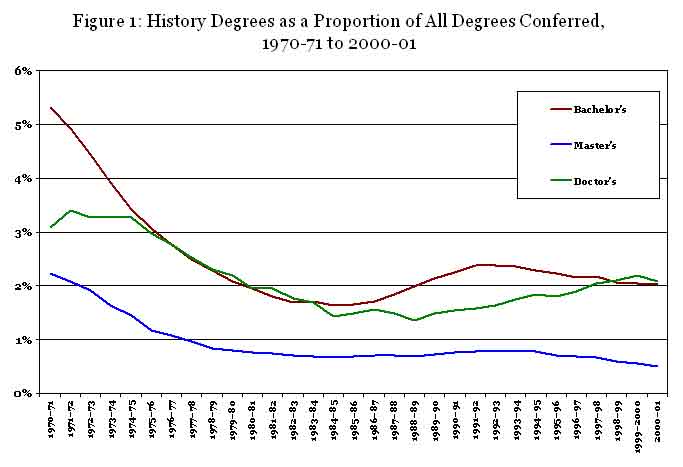
In the 2000–01 academic year—the most recent year with data available—history accounted for 2 percent of all bachelor’s degrees, 0.5 percent of the master’s degrees, and 2.1 percent of the doctorates conferred.

This represents a marked decline in both real and relative terms. Back in the 1970–71 academic year, history comprised more than 5 percent of the bachelor’s degrees conferred—accounting for 44,663 of the 839,730 degrees distributed that year. Thirty years later, history degrees were a mere 2 percent of all bachelor’s degrees—25,090 of the 1,244,171 bachelor’s degrees conferred (Figure 1).
History appeared to enjoy a resurgence in the late 1980s, as the re-introduction of history requirements in the undergraduate curriculum drew more students into the classroom. History began to wane again in the mid-1990s, but we have noted a recent uptick in the number of history majors.2
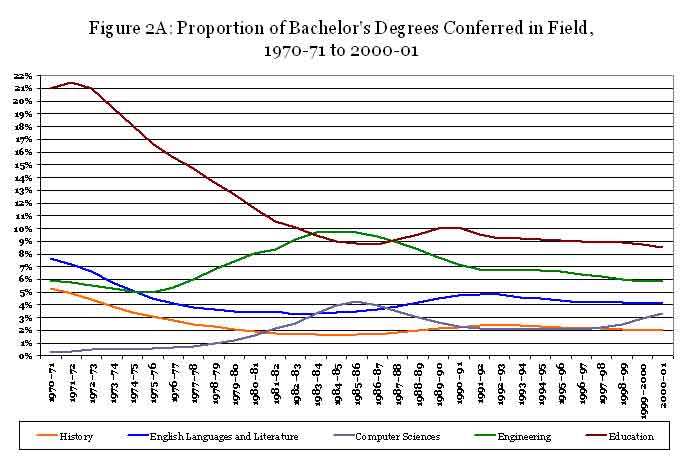
Science fields like engineering, computer science, and psychology gained significantly in the 1970s and 1980s as fields like history, English languages and literature, and education all declined. Education degrees fell farther than any other field over the same period—declining from 21 percent to just 8.5 percent of the bachelor’s degrees conferred over a 30-year span. In comparison, bachelor’s degrees in English languages and literature fell from 7.7 percent to 4.1 percent over the same period. (Figure 2A)

Divergent Trends for Advanced Degrees
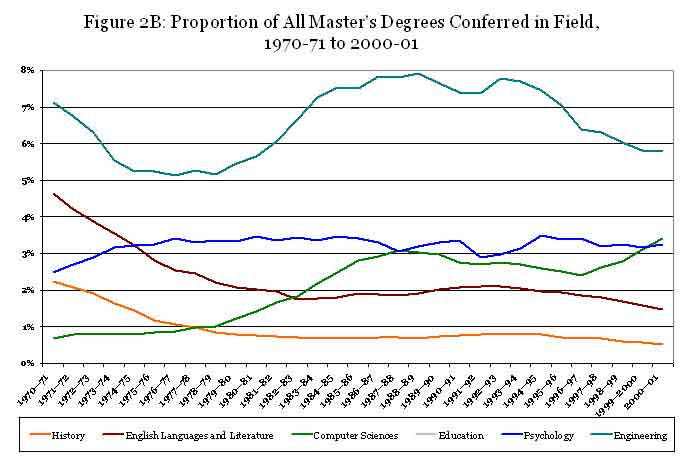
There was a marked difference at the master's degrees level. The number and proportion of history master's degrees also fell in the 1970s, but it never recovered. In 1970–71, history comprised 2.2 percent of all master's degrees, with 5,157 degrees conferred (Figure 2B).

The 2,365 degrees conferred in 2000–01 is a bit higher than at the low point in the mid-1980s. The number of history master's degrees grew until 1994, and fell steadily ever since. The absolute number of master's degrees in history thus increased over the past decade; but this growth lagged well behind that in other fields. In terms of history's share of all master's degrees, the figures are more dismal still: the most recent figure—just 0.5 percent of all master's degrees given—marks history's lowest point in 30 years.
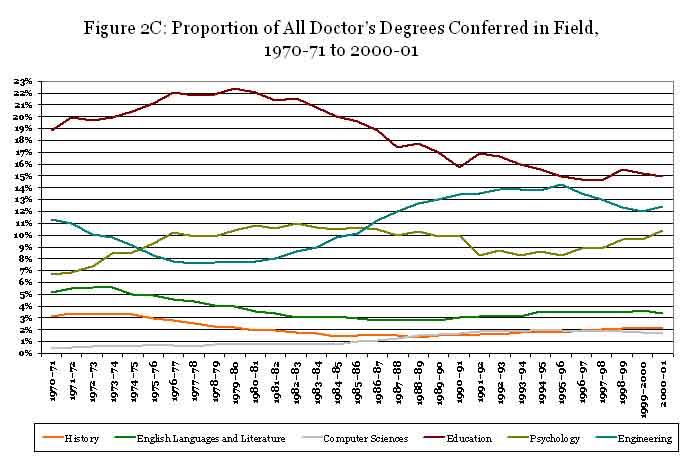
Up to the mid-80s, the trend in history doctoral degrees was quite similar. Between 1970–71 and 1985–86, history had declined by more than half as a proportion of all degrees conferred—falling from 3.1 percent of the doctoral degrees to 1.5 percent in 1983–84 (Figure 2C). But after 1984, the field rose steadily, climbing to 2.1 percent of the doctoral degrees distributed in the most recent year.

Degree Recipients More Likely to Be Men
The new information also provides some new demographic data about who is receiving these degrees. At every degree level, the field continues to draw a disproportionate number of men. In 2000–01, women comprise 42 percent of the new bachelor's degrees in history, 44 percent of the new master's degrees, and 39 percent of the doctoral degrees in history.
This contrasts with female majorities at the bachelors and master's level generally. Among all degrees granted, women accounted for 57 percent of the new bachelor's degrees, and 54 percent of the master's degrees conferred in 2000–01. In fields like English languages and literature, sociology, and anthropology, the representation of women is well over 60 percent among new degree recipients.
It is only in the distribution of new doctoral degrees that the history field is relatively close to the average. Women comprised 45 percent of all doctoral degree recipients. Fields like English, anthropology, and sociology have significantly higher representations of women—at over 58 percent. Fields like political science and economics are well below history, as less than a third of their new doctoral students are women.
Robert B. Townsend is AHA assistant director for research and publications.
Notes
1. Thomas D. Snyder and Charlene M. Hoffman, Digest of Education Statistics, 2002 (Washington, D.C.: National Center for Education Statistics, 2003). [Back to text]
2. Robert B. Townsend, “ History Majors and Enrollments Rose Sharply between 1998 and 2001,” Perspectives (February 2003), 7. [Back to text]
Tags: Graduate Education
Comment
Please read our commenting and letters policy before submitting.


