Technological Change Isn’t Linear
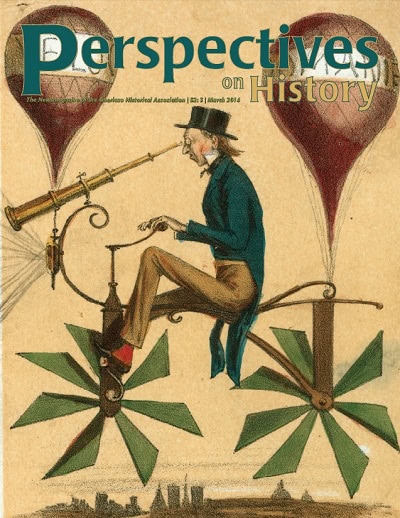
In her article in this issue on the history of technology, Barbara Hahn reminds us that technological change doesn’t move in a linear fashion, so historians of technology study not just what works, but also failures, fantasies, and forgotten solutions. “Eschewing the linear model leads historians of technology to study technological failure, which identifies the elements that help a technology work,” Hahn writes.
Image: Voyage a la Lune, hand-colored lithograph, c. 1865-70. Tissandier Collecti on, Library of Congress.
Staff