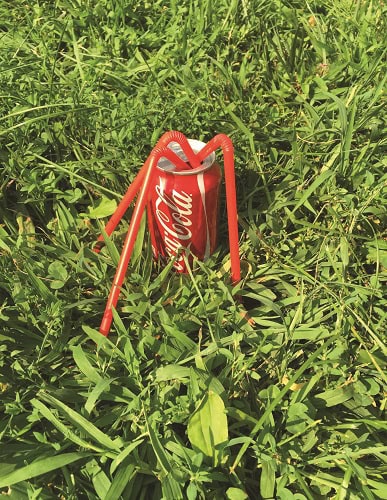
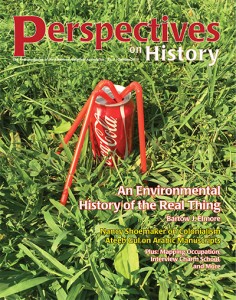
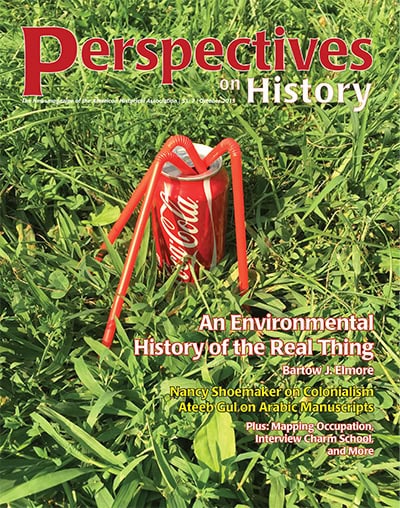
The Real Thing
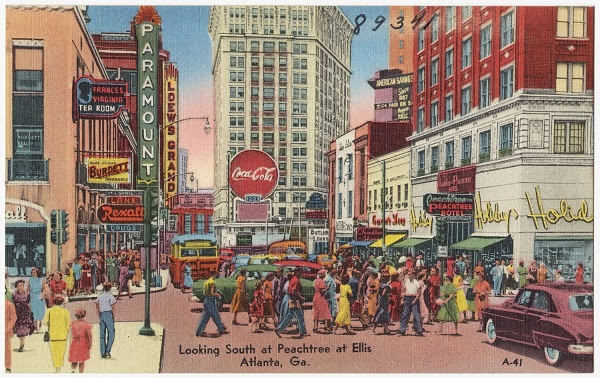
Our cover this month has a double meaning. We’re delighted to present a behind-the-scenes take from Bart Elmore on researching and writing his book, Citizen Coke: The Making of Coca-Cola Capitalism. Elmore shows us how researching the soft drink, ingredient by ingredient, yielded insights about the history of US capitalism. As it turns out, Elmore is a native of Atlanta, Georgia, where the AHA will be holding its 2016 annual meeting, January 7–10. In our expanded meeting coverage this fall, you’ll find nuts and bolts of conference-going, but we also hope you’ll discover Atlanta.
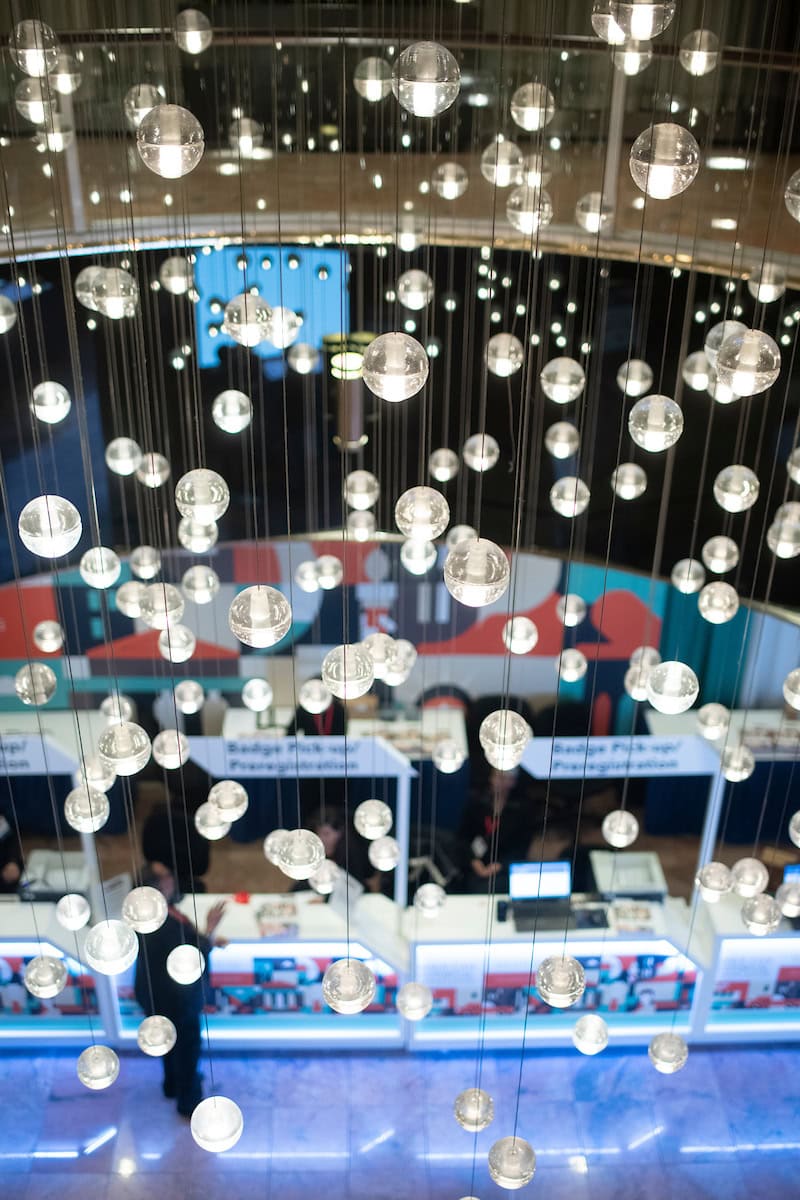
Photograph: Isabelle Smeall.
Staff