History departments at four-year colleges and universities reported a sharp increase in the number of undergraduate majors last year, according to information provided for listing in the AHA Directory of History Departments. The number of history majors in these departments rose 6.1 percent in the 2001–02 academic year over the year before. This continues an upward trend that began in 1998–99 (Figure 1).1 In addition, our annual survey of classroom offerings and enrollments, which lags a year behind the information on majors, shows a sharp increase in enrollments and class sizes among history courses.2
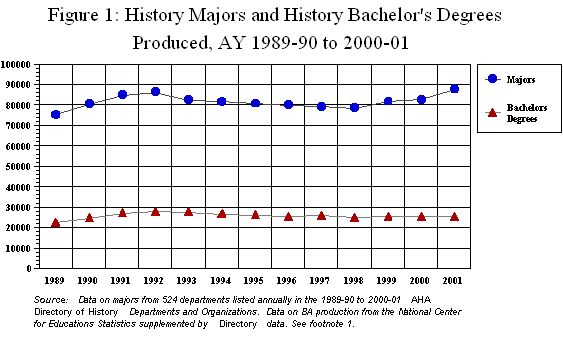
Figure 1
We watch the trend in the number of majors closely for clues about the job market for historians in academia, because growth in majors, enrollments, and degrees awarded places pressure on college and university administrators to support such increases with new faculty. This may explain why our most recent job market survey found a real increase in the number of full-time history faculty over the past year.3
We also watch the trend in majors for an indicator of where history stands in relation to other fields. Here the evidence is a bit more ambiguous, as the increase in the number of history majors appears to coincide with a general increase in the number of undergraduate students at America’s colleges and universities.4 Since our data set is not strictly comparable to that of the Department of Education, we cannot tell if the recent gains mark an improvement relative to other fields in the academy.
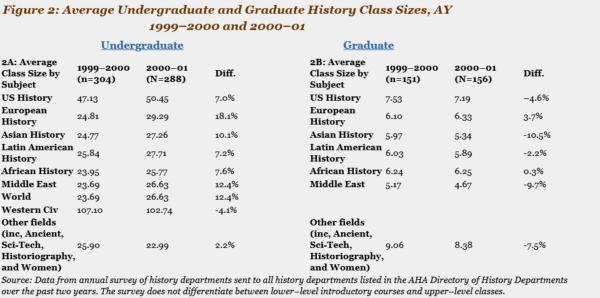
Figure 2
However, we can see that the general increase in student enrollments is reflected in larger history class sizes, despite the slight increase in new faculty. In our most recent survey of classroom enrollments (looking at the 2000–01 academic year), the average number of students per class rose between 7 and 18 percent in the main geographic field specializations over the year before (Figure 2, column A). Only world history and some of the more specific thematic courses showed a decrease in class size from the prior year.
The increases in both majors and class sizes were most pronounced at public colleges and universities, where the number of majors has grown almost 9 percent over the three years ending in the summer of 2002. At private independent colleges the growth in majors was a more modest 5.2 percent, while at private religious institutions it was negligible—less than 1 percent. Similarly, average class sizes grew almost 7 percent at public colleges and universities in the first two years of that span. Classes at independent institutions grew 5.8 percent, and dropped almost 2 percent at religiously affiliated colleges.
Classes and Enrollments at Different Programs
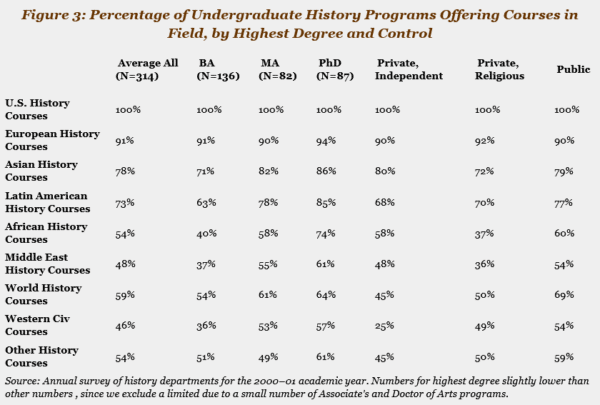
Figure 3
Our annual survey data also provide some additional information about the range of classes and enrollments in history departments, and the variations among different types of programs.
Perhaps most striking is the large average class size at many history programs and in many areas. While it may not be surprising that Western civ and world history classes are enormous—averaging almost 122 and 103 students per class—average enrollments of more than 50 students per U.S. history class point to the predominance of large survey classes (Figure 2, column A). Equally notable, these three subjects accounted for 63 percent of the students in history classrooms.
At programs where the highest degree is a BA (typically smaller liberal arts programs), average class sizes were significantly smaller—one-third to one-half the size—of their larger counterparts. However, the trade-off is in a more limited selection of courses, particularly for those interested in regions outside the United States. As Figure 3 shows, a smaller proportion of BA programs are teaching courses about areas outside of the United States and Europe.
The tendency to specialize in a few specific areas at these BA-granting programs produces an apparent anomaly in the average number of classes taught at each program (Figure 4) where the distribution of field specializations seems comparable to other program types. This is deceptive, however, as these BA-granting programs tend to offer a comparatively generous selection of courses in two or three geographic areas while providing no courses on other parts of the world.
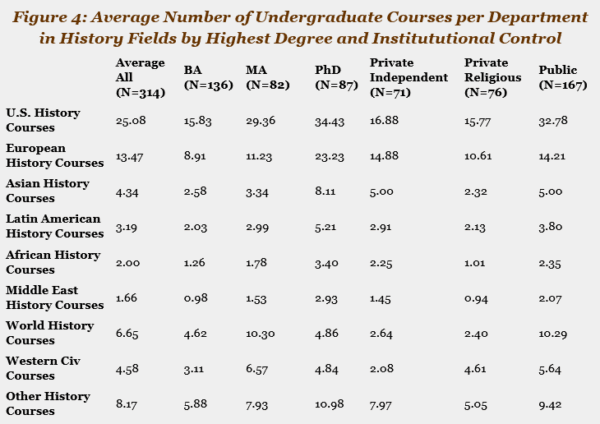
Figure 4
On the other hand, these figures should not lead to the inference that the larger programs have no limitations in coverage. At the larger public colleges and universities and MA-granting comprehensive programs, U.S. history comprises nearly 40 percent of the course offerings, as compared to just 30 percent of the course offerings at private independent institutions (Figure 4). The effect of this U.S. focus is particularly evident in comparison to offerings in European history. Public institutions offer an average of more than two U.S. history courses for every one in European history. The disparities are even more pronounced at programs whose highest degree is an MA, where the ratio between U.S. and European history courses is almost 3 to 1. In contrast, at private independent colleges the ratio is almost one to one.
This provides an interesting point of comparison to an AHA survey conducted 20 years ago, which found that a third of the course offerings in history departments that were listed in the survey were in U.S. history, as compared to almost 39 percent today. In comparison, European history courses have slipped from 29 percent of the course offerings in 1980–81 to just under 21 percent. Perhaps most notably, world and Western civilization courses have grown from 9.5 percent to almost 17 percent of the history courses offered, which reflects their expanded role in the curricular requirements at many colleges and universities in the late 1980s and early 1990s.5
Variations in Graduate Programs
In contrast to the trends in undergraduate students and classes, the number of history graduate students continues to contract. At PhD-granting programs the number of graduate students fell 2 percent between 1999–2000 and 2000–01. The number of students taking graduate-level courses declined only about 0.5 percent over the same time span, as MA-granting history programs continue to draw students (Figure 2, column B).
General trends in course offerings at the graduate level closely parallel the offerings at the undergraduate level. U.S. history is a larger part of the graduate-level offerings at public colleges and universities, which offer an average of about 10 percent more classes in U.S. history than their private counterparts. Private programs actually offer slightly more classes in European history than in any other field.
At the same time, however, history graduate programs at all types of institutions are prone to ignore large areas of the world in their course offerings. More than half of the history graduate programs do not offer graduate-level courses in fields outside of the United States and Europe.
Equally interesting, as the data in Figure 2, column B attest, the average number of students per class is relatively even across different fields, particularly in comparison to undergraduate courses. The average number of students per class falls within a fairly narrow span, ranging from 4.5 per class in Middle East history to a bit more than 8 in courses not tied to a particular geographic category.
Notes
- Data tabulated from information supplied for the Directory of History Departments and Organizations for the 1989–90 through the new 2002–03 editions. Departments supply the number of history majors in the department the previous year for inclusion in the Directory. The data is tabulated from 523 U.S. history departments listed continuously over that period. These programs produce approximately 91 percent of the history bachelor’s degrees in the country. In the 1999–2000 academic year, these departments produced 22,994 bachelor’s degrees, compared to 25,247 history bachelor’s degrees reported in National Center for Education Statistics, Digest of Education Statistics, 2001. To provide continuity where a department failed to supply information for a single year, we imputed data using the average of the two adjoining years. [↩]
- The survey asked for information about the 2000–01 academic year, and received responses from 349 of 654 U.S. departments that have listed in the Directory in one of the past two years. Only 288 of that number provided information about history classes and enrollments (compared to 324 the previous year). [↩]
- See Robert B. Townsend, “Job Market Report 2002: History Posts Gains Despite Economy,” Perspectives 41:9 (December 2002), 7. [↩]
- According to the Digest of Education Statistics, 2001, “Undergraduate enrollment rose 2 percent between 1998 and 1999.” The Department of Education’s most recent projections (in August 2002) estimated that enrollments would accelerate between 12 and 19 percent between 2000 and 2012, National Center for Education Statistics, Projection of Education Statistics to 2012. [↩]
- Survey of the Historical Profession: Academia, 1980–81 (Washington, D.C: American Historical Association, 1981), 10. [↩]