Figure 1
The latest data on the history job market for the 2001–02 academic year provides some evidence that the profession is suffering from the recent economic downturn and budget cutting at the state level, as a number of jobs posted last year were cancelled by university administrations and junior faculty jobs took a slight dip. However, many key indicators remain quite positive, as the overall number of job listings for historians reached unprecedented heights, departmental listings in the new AHA Directory of History Departments indicate a slight gain in the number of full-time faculty, and the number of new PhDs is leveling off.
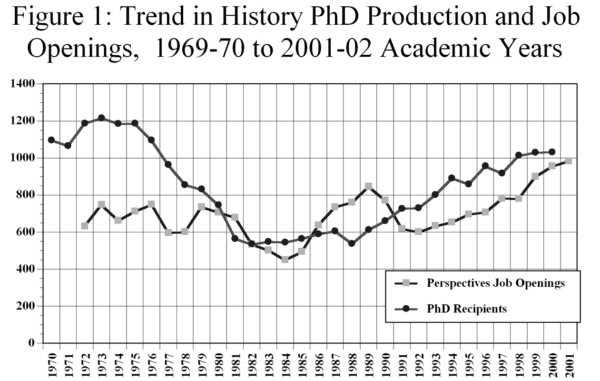
Overall, the number of job openings advertised in Perspectives rose for the sixth year, but openings for junior faculty (at the instructor or assistant professor level) actually fell 5.4 percent from the year before. The total number of job listings was inflated by an increase in the number of openings limited to senior scholars, nonacademic positions, and fellowships offering more than $25,000 per year, which rose 2.9 percent to 982 from 954 openings the year before (Figure 1).1 Among these positions, there were 70 postdoctoral and research fellowships (up from 49) that offered a livable income but no long-term job prospects, as well as listings for 59 jobs for PhDs outside of higher education (up from 31 last year).
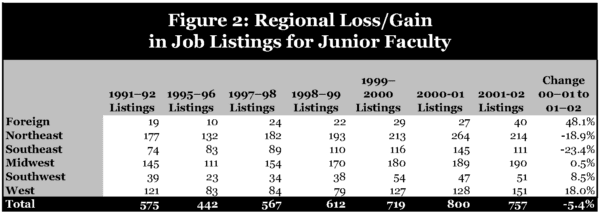
Figure 2
Looking more specifically at the openings for new PhDs in the academy, the trends appear exceptionally uneven both across the nation and among different field specializations. Viewed by the location of prospective jobs (Figure 2), the contraction appears to be hitting hardest along the East Coast, as job openings fell 19 percent in the Northeast and 23 percent in the Southeast. In contrast, available jobs gained ground in the rest of the country, and did particularly well along the Pacific coast, where the number of jobs rose 18 percent.
A similar differentiation appears when one looks at the geographic area specializations being requested in the ads (Figure 3). Openings in Asian and Latin American history were up by over 18 percent, while postings for every other geographic area declined, by as little as 4.4 percent for specialists in U.S. history to as high as 42 percent for historians of Africa.
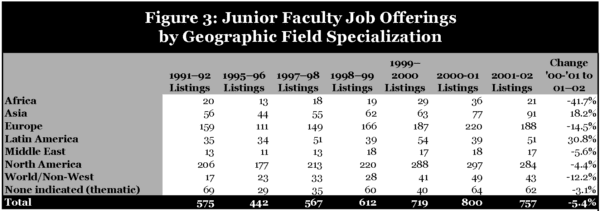
Figure 3
For the second year, we also analyzed the listings for any mention of particular field specializations (Figure 4). Even though it does not differentiate between primary, secondary, and “preferred” areas of specialization, this tabulation does provide a more detailed indicator of how many advertisers were seeking a particular field of specialization.
The most notable change from the prior academic year was a decrease in requests for broad thematic specializations such as social, political, and cultural history. Departments seemed much more specific about the types of history specialists they wanted this past year. Since we have only last year to compare it to, and the numbers in all but the largest categories are fairly small, it is difficult to say whether this sort of fluctuation is the norm.
Survey of Advertisers Points to Conflicting Problems
A survey of search committees who advertised jobs in Perspectives last year suggests that the recent budget cutting at many universities did have an impact on the academic job market for historians. But the survey also pointed to another problem (although a problem with more positive connotations), as search committees in a number of fields reported a growing problem on the supply side. A number of departments complained that they could not hire the candidate they wanted because the available jobs seemingly exceeded the number of qualified (or at least “desired”) candidates.
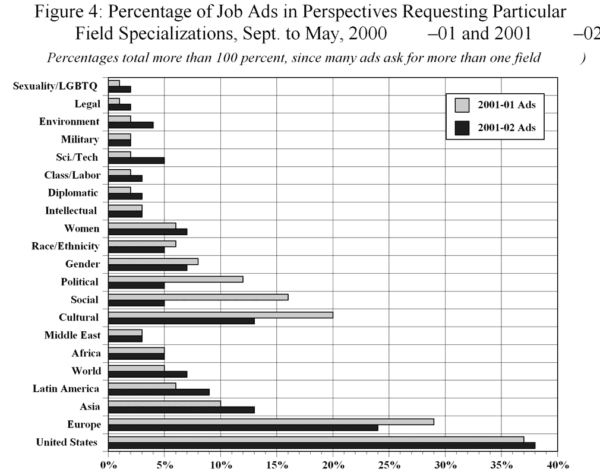
Figure 4
To elicit information on reported budget cutting and hiring freezes in history departments, staff sent a survey to everyone who advertised a position in the Employment Information section of Perspectives last year, asking how many applicants applied for the position, whether the position was filled, and the status of the hire. Unfortunately, the responses to the surveys about senior and nonacademic openings were inadequate for reliable analysis. However, we did receive responses from over 54 percent of those advertising positions open to junior faculty (409 of 757). Since these closely represented the subject fields advertised and the institutional types doing the advertising, we feel comfortable making them the focus of analysis.
The most notable finding from the surveys was that just over 20 percent of the advertised positions (85 of 409 responses) for junior faculty were unfilled as of this fall. This marked a significant increase from similar surveys conducted over the past 6 years, in which around 12 percent of all advertised positions went unfilled.
While that sounds quite appalling in the present climate of budget cutting, the reasons search committees gave for not hiring someone suggest a more complex picture, and one that highlights significant disparities among the subfields of the discipline. The budget ax seemed to fall hardest on African history, where 17 percent of the respondents said their search had been cancelled for budgetary reasons. Latin American and European history fared little better, as around 8 percent of the positions in those fields were reported cancelled. In comparison, U.S. history did fairly well, as “only” 4.5 percent of the responding institutions told us they could not fill their position due to budget cuts or hiring freezes.
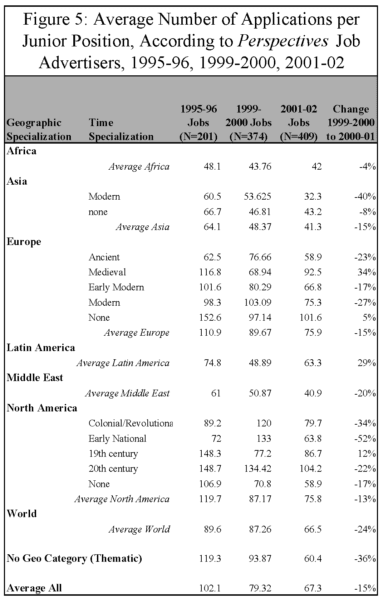
Figure 5
This stands in marked contrast to the fields of Asian and Middle Eastern history, where the more pressing problem seemed to be the lack of a sufficient number of suitable applicants for available jobs. Perhaps not surprisingly, given recent events, none of the positions in Middle Eastern history were reported cancelled, and fully one-third of all positions went unfilled due to a lack of qualified applicants or because one or more of the selected candidates turned down the offer. Similarly, while 6 percent of the Asian history positions were cancelled, a much larger proportion of the positions (25 percent) went unfilled because the search committees couldn’t find someone to take the job.
In contrast, only around 5 percent of the positions in European and Latin American history went unfilled for lack of a suitable or willing candidate. The responses in U.S. history add another small wrinkle, as almost 15 percent of the positions went unfilled due to a lack of candidates, often because they were seeking a specialist in a particular field of racial or ethnic history (African American or Hispanic and Latino American history).
For almost all of the positions that went unfilled (83 percent), the departments reported they would reopen the search-half of them in the current academic year. The response rate was similar among those cancelled for budgetary reasons and those without an acceptable candidate. Most (61 percent) said they would re-advertise the position in the current academic year.
On a more positive note, in almost every field the number of applicants per position is down markedly from two previous surveys conducted among advertisers in 1995–96 and 1999–2000 (Figure 5). On average, the number of applicants has declined 15 percent from the survey conducted just two years ago. And even in fields with significant disparities between jobs and new PhDs-particularly 20th-century U.S. and modern European history-the average number of applicants is down by over 20 percent.
On one of the persistent questions people put to us-about how many people from non-history departments are competing in the history job market-the results were rather surprising. Just over 12 percent (42 of 324) of the newly hired received their PhD from a program other than a history department. The largest number—though only 3 out of that 42—had received their PhDs from American studies programs.
Long-Term Trends Remain Positive
Many of the broad indicators we look at for signs of the future are also quite positive. Information submitted for the 2002-03 Directory of History Departments indicates that departments did not experience a contraction in the number of full-time faculty, and actually enjoyed a net increase overall. At the same time, the proportion of the faculty members in history departments who are now approaching retirement now stands at the highest point in six years. Meanwhile, on the supply side, the number of new admissions to history PhD programs continues to decline, and the numbers of new history PhDs is leveling off.
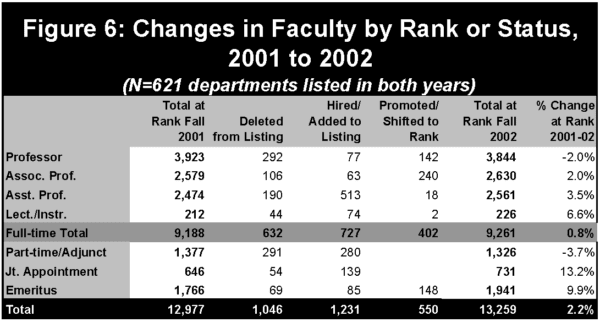
Figure 6
Perhaps the best news is evidence of modest growth in the number of full-time faculty, despite the recent problems in the economy and state budgets. Among the 621 departments listed in both this and last year’s editions of the Directory, the number of full-time faculty actually increased, although by a modest 0.8 percent (Figure 6), as almost all of the retiring senior professors were replaced with assistant professors, and a number of other departments hired replacements for positions left vacant in the prior year.
While the Directory listings do not provide specific evidence about the terms of employment, our survey of search committees suggests that most of these hires were to tenure-track appointments. Just over 90 percent of the faculty hired at the assistant professor level were brought in on the tenure track.
As we noted last year, the profession is in the midst of a large wave of retirements from history departments. As indicated in Figure 6, just over 6 percent of the faculty at the full and associate professor left their jobs last year. While just under a third of them left for jobs at another college or university, the great majority were retiring permanently from full-time teaching. This is reflected in the large number of faculty listed in the “Emeritus Faculty” category, which has been the fastest growing segment for the past six years, and now accounts for 14 percent of the historians listed at departments in the Directory.
Despite the large outflow of senior faculty over the past six years, the proportion of faculty in their late 60s (and thus likely to be near retirement) has actually increased over the past six years. As of this fall, we estimate that 22.4 percent of full-time history faculty members were over the age of 66, up from 17.9 percent six years ago.2 This cohort encompasses faculty hired during the sudden sharp increase in hiring in the late 1960s and very early 1970s, which accounted for more a third of all history faculty as recently as six years ago.
Since the current wave of retirements is likely to continue and so many colleges and universities are experiencing economic hardship, we were particularly interested in any signs that the history departments are retaining and refilling vacated budget lines. Certainly the slight increase in the number of full-time faculty is a very positive indicator. However, the respondents to our survey of search committees added a note of caution about the future.
We asked respondents to estimate how many retirements they anticipated in the next five years, and how many of those retirees they could replace. Eighty-one percent of the 303 departments that ventured an estimate thought that at least one member of their faculty would retire in the next five years, averaging out to almost three retirements per department.3 However, they were not terribly optimistic about their ability to replace all of their departing faculty. Just over 11 percent (34 responses) said they were too uncertain to even offer a provisional estimate of how many faculty they could replace. Another 15 percent of the respondents expected that the retirements would result in a net loss of one or more faculty from their department. Despite that finding, however, respondents who offered an opinion estimated they could replace 91 percent of their retirees.
Not surprisingly, given recent budget cutting at the state level, respondents at public colleges and universities were significantly more pessimistic, expecting more than three times as many lost positions as private institutions.
Further Improvements on the Supply Side
On the supply side of the equation the news is far better, as the number of new students admitted into PhD programs, the number of students in the programs, and even the number of dissertations in progress all fell again last year.
The number of new graduate students admitted to history PhD programs declined last year, falling to 2,388 new students admitted in the fall of 2001. Admissions reached their peak ten years ago, when 3,320 students were admitted and have declined every year since. It should be noted that last year’s decline came in spite of the intentions of the departments, who collectively had hoped to admit almost 100 more students. The disparity between the programs’ estimates for admissions and the number of students actually admitted suggests some reluctance among prospective history students to enter PhD programs in the current climate. Perhaps because of the recent declines and shortfalls in admissions and signs of improvement in the job market, departments reported that they hope to reverse that trend fairly sharply this fall. PhD-granting history programs estimated that they would admit 2,560 new students into their programs this year.
PhD-granting history departments reported 11,359 “actively enrolled” graduate students in their programs last year, down 2 percent from the year before and 15.4 percent from its peak of 13,429 in the 1995–96 academic year. At the same time the number of history dissertations reported to the AHA as “in progress” fell 2 percent to 3,760-the third annual decrease and the smallest number since the AHA began systematically collecting this information in 1997–98.
These declines have yet to have a direct impact on the number of new PhDs produced, which was essentially the same as it was the year before. Since it takes an average of over eight years to complete a history PhD, the production of new PhDs has lagged well behind the trend in admissions and enrollments.
Directory Editor Liz Townsend assisted in the tabulation of data from the new edition.
Notes
- The AHA has been categorizing the field specializations for job openings since the academic job market began its decline in 1991-92. See Susan Socolow, “Analyzing Trends in the Job Market,” Perspectives 32:5 (May/June 1993) and Robert Townsend, “Academic Job Opportunities Better than Expected in 1997,” in Perspectives 36:7 (October 1997), 9. [↩]
- This is calculated on the basis of a simple tabulation of the number of faculty who received their PhDs more than 31 years ago, and assuming an average age at the time of degree of 32, based on data from the annual Summary Report: Research Doctorates in the United States and the last survey of Humanities Doctorates in the United States, conducted in 1995. [↩]
- Ninety-three percent of the respondents answered the question, but the number tabulated is significantly smaller than the total number of respondents because a number of departments had more than one position listed last year. [↩]

