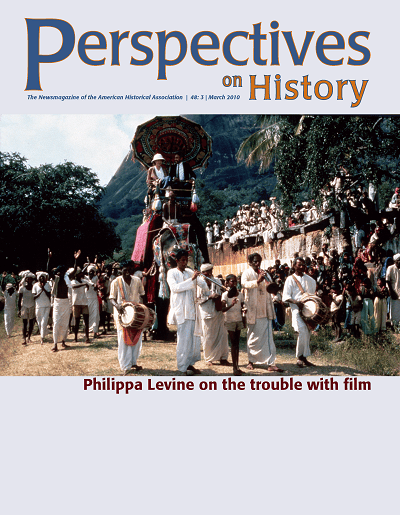
News

Putting Academic History in Context: A Survey of Humanities Departments

Robert B. Townsend | Mar 1, 2010

Before the present economic crisis, history departments were hiring more tenure-track faculty than they were losing by attrition, and they were conferring tenure on their faculty at a much higher rate than counterparts in other humanities fields.

These are some of the key findings from a just-released 2007–08 survey of departments in eight humanities disciplines released recently by the American Academy of Arts and Sciences (AAAS). The survey was conducted by staff at the American Institute of Physics as part of the AAAS Humanities Indicators Project (available online at www.amacad.org/projects/indicators.aspx).

The numbers reported are based on a sample survey, however, so they represent statistical estimates, and should be read as approximations of reality. Nevertheless, by comparing these results to other available surveys from the federal government and the AHA, we can have a high level of confidence in their findings.

Comparing History to the Other Humanities

The authors of the study calculate that as of fall 2007, there were 929 history departments in 4-year colleges and universities with 15,360 faculty. Among the humanities departments surveyed, history was smaller than the departments of languages (which had approximately 30,680 faculty in English language programs and 23,320 in foreign language departments), but significantly larger than the other disciplines and subjects surveyed—religion, art history, linguistics, and the history of science. Religion departments, for instance, had just 5,019 faculty.

The survey shows the wide variations among the different departments that comprise history in higher education. Broken down by highest degree conferred (Figure 1), a majority of history departments (554 of the estimated 929) confer the baccalaureate degree as their highest degree. In comparison, only 171 confer a doctorate as the highest degree.

Figure 1While doctoral programs comprise the smallest portion of departments in history, they employ a plurality of the faculty in history departments (5,730 of 15,360). On average, departments that confer the doctorate have more than three times as many faculty members as their counterparts that only confer baccalaureate degrees. The survey estimates just over 33 faculty per department at history doctoral programs, as compared to just 9.2 per department conferring bachelor’s degrees.
English language departments are much larger than other programs in the humanities—averaging 27.9 faculty members per department. In comparison, history departments averaged only 16.5 faculty per department. Foreign language departments average 16.8 faculty, religion departments average 9.2, and art history programs average 8.5 faculty. Specialized history of science programs averaged 8.9 faculty.

The survey indicates that the proportion of history faculty employed on the tenure track in four-year colleges has been essentially unchanged—and has perhaps improved—since the last significant survey of faculty. A federal survey conducted in fall 2003 indicated 69 percent of history department faculty at four-year institutions were employed on the tenure track or with tenure. The more recent survey estimates that 74 percent of the history department faculty are employed in tenure-eligible positions. Two-thirds of the faculty working off the tenure track (18 of 26 percent) were employed part time. Because the data for the new survey was gathered using a different method, the apparent differences between the survey results should be read with some caution. Nevertheless, it is clear that history has done well in retaining tenure-track positions.

In comparison, other humanities programs have a much smaller proportion of tenure-eligible faculty. In English programs, for instance, half of the faculty are employed off the tenure track (with 31 percent employed part time, and another 18 percent employed full time but off the tenure track). Similarly, in the foreign language departments, 48 percent of the faculty are employed off the tenure track (with 22 percent employed part time, and 26 percent employed full time but off the tenure track).

The new survey also indicates a significant increase in the proportion of women in history departments over the past decade. A federal survey in 1998 found just 27.9 percent of all history faculty members were women. This new survey indicates that in 2007, 35 percent of history department faculty were women (Figure 2).

Figure 2The recent gains bring the proportion of women faculty in departments into closer parity with the ratio of women among those receiving history PhDs over the past decade (currently running at a little over 40 percent of all new history PhD recipients).

Despite these recent increases in the proportion of women faculty, the gender composition of history departments remains very different from the other humanities. In the languages and art history, for example, 55 percent or more of the departmental faculty were women.

Happier Times for Hiring and Tenure

The survey indicates that just before the economic crisis hit higher education, history departments hired more faculty than they lost through retirement, death, or other causes. The survey reports a turnover rate of almost five percent of all history faculty in the two years prior to the survey.

The authors of the report estimate that an average of 430 faculty left their departments in the previous two years, but the departments recruited an average of over 640 new faculty (for the 2007–08 and 2008–09 academic years). Of course, not every position advertised resulted in a hire, but it still reinforces the evidence from our other surveys that there was a net growth in hiring to history departments prior to the recent round of budget cutbacks and hiring freezes.

Among those faculty already hired, the survey shows an exceptionally high rate of tenure in history departments, as around 98 percent of the historians coming up for tenure received it. This is a higher rate of tenure than indicated in an earlier AHA survey, which had found that 94 percent of history faculty coming up for tenure received it. In comparison, other humanities disciplines had a tenure rate of close to 90 percent, and in the case of the foreign languages, as low as 84 percent (Figure 3).

Figure 3Unlike the AHA study, this survey also asked departments to report on the number of faculty who left before they came up for tenure. The departments reported that almost 22 percent of the faculty coming up for tenure left prior to the start of the tenure process.

This brings the success rate for junior faculty closer to the norm in the other humanities disciplines. Among most of the surveyed disciplines, between 18 and 22 percent of the tenure-eligible faculty left prior to tenure. Religion and foreign language programs were the exception here, as 27 percent of their junior faculty left prior to the start of the tenure process.

The survey also asked about the key criteria for tenure. It will come as no surprise that publications remain vital to tenure. The authors of the report estimate that publications are essential to tenure in 67 percent of the history departments. Even though it was not essential, all of the other departments indicated that publications were at least important for tenure.

Like history, two-thirds of art history and foreign languages departments reported that publications were essential to tenure, but in English and religion departments, just over half of the departments classified publication as actually essential to tenure.

Among all the humanities disciplines teaching was rated slightly higher as an essential criterion in tenure decisions (identified as essential by 78 percent of the humanities departments), while service was rated as significantly lower (classified as essential by only 25 percent of the departments).

Students

The survey offers some modest information on the number of students in the different departments. Unfortunately, the questions about enrollments in undergraduate classes did not elicit a valid set of responses (due to an effort to distinguish between upper- and lower-division courses). But the study does provide useful comparative evidence about the number of bachelor’s degrees completed, the number of majors in each program, and the number of graduate students.

History conferred the second highest number of degrees in the humanities—almost 42 baccalaureate degrees per department, compared to an average of almost 50 bachelor’s degrees in English departments (Figure 4). The other departments in the humanities conferred an average of 20 degrees or fewer.

Figure 4Curiously, the authors of the report estimate an almost equal number of students majoring in the subjects of history and English. The number of students earning degrees in history has been growing much more rapidly than English in recent years, but it remains a long way from surpassing English in the number of degrees conferred. (As of 2006–07, English programs conferred 55,122 degrees, as compared to 34,446 in history.)

Among the institutions conferring history degrees, there are wide differences in the number of students in particular programs that mirror the differences in the average number of faculty. Doctoral programs confer a nearly half of the undergraduate degrees, and almost three-fourths of the graduate degrees in the discipline.

The authors of the survey calculate that 18,830 of the 38,700 baccalaureate degrees conferred by history departments were conferred by doctoral programs. In comparison, programs that only award the bachelor’s degree conferred approximately 12,780 baccalaureate degrees.

Note that the total estimated number of undergraduate degrees conferred was more than 10 percent higher than the number reported by the U.S. Department of Education for the same year. This is explained by the variety of other specialized degrees conferred by many history department, such as teaching degrees, which are classified elsewhere in the federal government’s tabulations.

Robert B. Townsend, the AHA’s assistant director for research and publications, served on the steering committee for the survey of humanities departments. Some of the figures accompanying this article were prepared for a report published on the AAAS web site.


Tags: History News Job Markets


Comment

Please read our commenting and letters policy before submitting.