The career paths of faculty into the upper ranks of the profession have changed over the past 50 years, as degrees from top-tier universities have diminished a bit in value, and expectations for publication have increased throughout academia. While faculty from an expanding array of doctoral programs are finding their way into the senior ranks, faculty who cannot publish a second or third monograph—often even at 4-year colleges with teaching missions—appear more likely to find themselves “stuck” at the associate professor level, or locked out of the upper ranks of the profession altogether.
These findings are based on a wide-ranging survey of 2,240 associate and full professors in the United States and Canada. The survey, conducted in spring 2011, was intended to provide a broad understanding of the challenges and hurdles overcome by scholars in the upper ranks of the profession.1 The dataset has some flaws, as the AHA’s Directory of History Departments and Organizations, which provided the survey population, contains a disproportionate number of research universities and only a small fraction of the community colleges with history faculty. But the mix of institutions in the survey does reflect the aspirational goals of students in PhD programs, who overwhelmingly look toward to careers at institutions focused on research.2
Getting off to a Good Start
Not surprisingly, a degree from a well-established and highly rated program appears to play a vital part in getting an academic career off to a good start: more than two-thirds of the respondents had earned their degrees at a top-rated school.
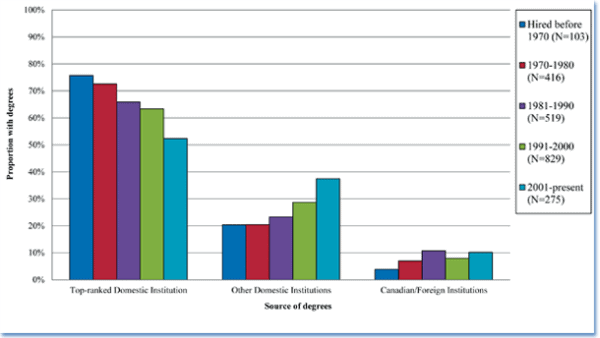
Among senior faculty hired before 1991, 69.6 percent received their degrees from one of the 27 institutions rated in the top quarter of the National Research Council’s 1995 rankings of history PhD programs—and just 10 institutions accounted for 46.9 percent of the respondents to the survey. But that pattern has changed slightly over the past two decades. Among faculty hired since 1991, only 60.6 percent earned their degrees at a top-ranked institution, and the top 10 institutions conferred only 34.2 percent of the degrees (Figure 1).3

Figure 1: NRC Ranking and Location of History Programs in Institutions Conferring PhD on Senior Faculty, by Year Hired
The diminished proportion of senior faculty from top-tier programs partially reflects the widening pool of programs conferring PhDs, as 94 other institutions conferred a PhD on at least one of the respondents. Students from top-tier institutions continue to have a clear advantage, however, as their representation in the senior ranks of the profession remains more than 50 percent higher than their numbers among the doctoral degrees conferred in the discipline. The top quartile of institutions in the NRC rankings conferred 46.2 percent of the domestic PhDs in the discipline from 1961 to 1990, and awarded 38.8 percent of the history PhDs in the years since.
Foreign institutions and programs outside of traditional history departments also play a significant role in the employment market for history. Among the survey respondents, 6.5 percent earned their degrees from a foreign university, and 10.1 percent reported a degree from another program at a domestic institution—particularly in the fields of American studies/civilization, the history of science, and medieval studies.
For students from institutions outside the top-tier, it appears institutions classified as master’s-level colleges and universities offer the best path into the discipline, as 52.7 percent of their senior faculty held degrees from the top tier of programs. In comparison, among respondents at research universities 74.3 percent earned their degrees at one of the top 27 institutions in the rankings, fairly close to the 69.1 percent of the respondents at baccalaureate institutions.
Career Mobility
Regrettably, the survey did not ask the respondents for significant details about the transition between their degree and their first appointment as an assistant professor, leaving an important gap in our understanding of the full career path. We only know that on average, the respondents found their first position as an assistant professor at the age of 33, and that the average age has increased in each of the past three decades.
Respondents hired since 2000 were on average 35.7 years old at the time of their first tenure-track appointment, as compared to the average age of 34.7 years among those hired from 1991 to 2000, and 33.3 years among those hired between 1981 and 1990. The rising age threshold for entering assistant professors (and thus the increasing time on the job market) is reflected in part in the growing number of postdoctoral fellowships and adjunct positions that now serve as a temporary bridge between a degree and the tenure track.4
After making it over the hurdle to that first tenure-track appointment, faculty members who successfully reached the rank of associate professor spent an average of 6.1 years on the tenure track. Respondents who then moved on to full professorships, did so an average of 7.6 years after their promotion to associate.
Given the scope of the survey, it is impossible to determine the characteristics of faculty members who failed to advance to the associate level, but the publication of one or more monographs was a critical marker in advancement through the profession—even at teaching institutions. Overall, respondents at the associate level reported they had published an average of 1.2 monographs and 6.5 refereed articles, while full professors reported an average of 2.7 monographs and 15.9 refereed articles.
Even at teaching-oriented institutions, such as baccalaureate colleges, the faculty members reported high levels of scholarly production. Associate professors at baccalaureate institutions reported an average of 1.0 monographs and 3.8 peer reviewed articles, while full professors indicated an average of 2.2 monographs and 10.3 articles. In comparison, among respondents at research universities, the associates reported an average of 1.3 monographs and 7.3 articles, while professors reported 3.1 monographs and 19.3 articles.
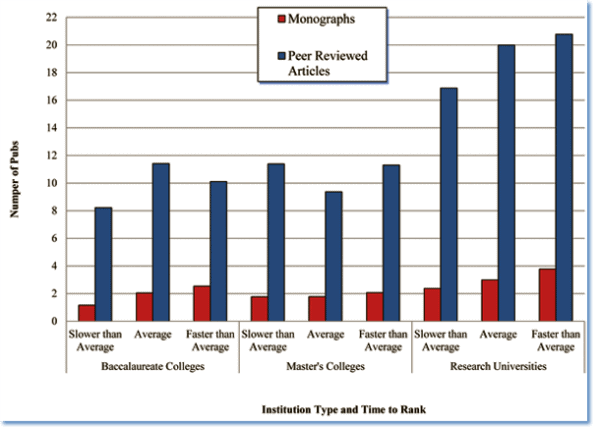
The number of publications closely correlated to the amount of time the respondents spent moving through the ranks (Figure 2). Faculty members who had been at the associate professor level for eight years or more reported an average of one-third fewer publications than counterparts in the same age cohort who had moved up to the professor level. Overall, faculty members who had been at the associate professor level for more than eight years reported an average of only 1.2 monographs at the time of the survey, as compared to an average of 2.7 books among faculty members who had achieved the rank of professor. In comparison, professors who achieved the rank in less than 7 years had published an average of 3.1 books, as compared to 2.2 books among those promoted after eight years or more.

Figure 2: Average Number of Career Publications by History Professors, Based on Time to Rank
The differences in publication rates were pretty consistent across the different institution types, as faculty who had taken longer than average to achieve the rank of professor reported a smaller number of publications than the faculty members who had moved between the ranks more quickly. And faculty who had been stuck at the associate professor level for 15 years or more, averaged even fewer books and articles than those who had earned promotion in their age cohort.
The high value given to the products of research over other forms of activity was evident in a series of qualitative questions, which asked respondents about the perceived value of different types of activity for tenure and promotion at their institutions. Print monographs were rated as “highly valued” by 74 percent of the respondents—and “not valued” by only 2.2 percent. The only other activity rated as highly valued by a majority of the respondents was the publication of articles in print journals (highly valued for 64.8 percent of the respondents). The other activities that came close, in the estimation of the respondents, were teaching (rated as highly valued by 48.8 percent of the respondents) and grants (rated high by 46.1 percent).
The respondents generally dismissed other forms of activity. Department service was highly rated by just 9.5 percent of the respondents; articles and books for general audiences were significantly valued by less than 10 percent each; publication of online monographs earned high marks from 10.4 percent of the respondents; and the development of online courses for distance education was highly rated by just 4.3 percent.5
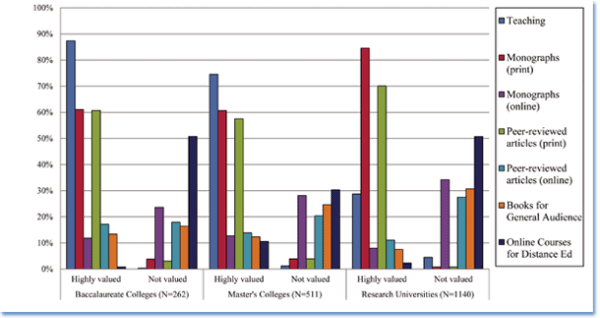
Only a few of the responses varied depending on the type of institution (Figure 3). At Baccalaureate colleges, 87.4 percent indicated that teaching was highly valued, as compared to 28.8 percent of the faculty at research universities. The gap between their evaluations of research, however, was not as wide, as 61.1 percent of the respondents at baccalaureate institutions reported the publication of print monographs was highly valued, compared to 84.6 percent who said the same at research universities.

Figure 3: Perceived Value of Particular Activities for Promotion and Tenure at Institution, by Carnegie Type
The respondents made clear that other activities are given very little credit in their departments. The respondents reported relatively little experience with digital publishing, and with few exceptions, they consistently rated digital publications—from monographs to online teaching—as holding little value in the tenure and promotion process.
Aside from the evident tangible effects of publications and teaching on a tenure and promotion portfolio, some faculty members have materially advanced their careers by moving between institutions. But the survey respondents indicated that such moves were relatively rare after the initial appointment to the tenure track.
Just over a quarter of the respondents (28.0 percent) reported that they had moved between institutions at least once after they received their first appointment as assistant professor. Almost one in five respondents (17.6 percent) shifted institutions while at the rank of assistant professor, and 15.8 percent reported shifting between institutions while at the associate professor rank.
From past surveys about tenure practices in the departments, we know that around 85 percent of the assistant professors who come up for tenure will receive it, but that does not account for faculty who left the department before their tenure portfolio moved forward. Based on the experiences of the respondents, it appears that faculty members who are delayed on their path to tenure are more likely to be hobbled throughout their career. One-fifth of the faculty members who took longer than the norm to earn tenure took longer than average to move from the associate to full professor position or remained stuck at the associate level altogether.
A Wide Gap between Time and Value
Even though respondents indicated that publications were more highly valued than teaching for career advancement, they reported that most of their time during the school year was spent on instruction-related activities. As one respondent noted, “publishing is the main standard of evaluation for advancement but the time demands of teaching and committee work are very heavy.”
On average, the respondents spent 30.9 hours each week on teaching and instructional activities. That compares to an average of just 9.7 hours per week on research related activities, 11.1 on service to their department and institution, and another 1.9 hours on other forms of professional service (such as serving as peer reviewer for a journal or as officer in a society). Respondents also estimated that they spent an average of 6.8 additional hours per week on child and elder care.
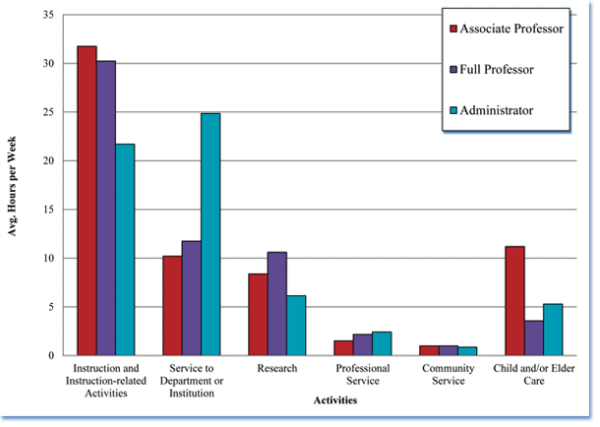
Surprisingly, excluding faculty in administrative positions, the estimated time spent on instruction was almost identical at both the associate and full professor levels, as associate professors reported an average of 31.8 hours per week on teaching-related activities, as compared to 30.2 hours by full professors (Figure 4). The largest differences were in time spent on research (8.4 hours among associate professors, 10.6 hours among full professors), and time spent on family care (11.2 hours among associates and 3.6 hours among professors).

Figure 4: Estimated Time Senior Historians Spent each Week on Select Activities, by Rank
Faculty at research universities spent almost 20 percent less time on instruction-related activities than faculty at other types of institutions. Associate professors at research universities spent an average of 29.6 hours per week working with or for their students, as compared to 34.4 at Master’s-level institutions and 36.5 at baccalaureate institutions.
The time allotments among the respondents also seemed to differ based on the institution that conferred their doctorates. Faculty members with doctorates from programs in the top-tier of the rankings spent an average of 29.9 hours on instruction, while professors from programs ranked in the bottom quartile of the NRC rankings averaged 35.3 hours on instruction and instruction-related activities. The difference is partially attributable to the more teaching-intensive types of institutions that tend to hire faculty from lower-ranked programs, and partially due to the larger proportion of faculty from lower-ranked programs still at an early stage in their careers.
Within the ranks, the variations were much smaller. At the associate professor level, for instance, faculty from top-tier programs reported an average of 31.0 hours per week on teaching, while faculty from institutions in the bottom quartile averaged 32.3 hours per week. Curiously, however, associate professors from top-tier programs reported spending slightly less time on research compared to their counterparts from lower-ranked programs (at an average of 8.7 hours per week compared to 9.8 hours).
Satisfaction
Overall, the respondents were exceptionally satisfied with most aspects of their jobs and careers. Over 70 percent of the survey respondents reported satisfaction with the level of control they have over their courses (95.5 percent), their workloads (72.5 percent), their colleagues (80.3 percent), and their opportunities for advancement (84.7 percent).
But the respondents were more ambivalent about the time available to stay current in their fields and the leadership of their institutions. Only a slight majority of the respondents expressed satisfaction with the time they had available to “stay current with developments in the field.” And a particularly large proportion, 14.6 percent, reported that they were very dissatisfied on this score. This seemed to be a particular concern among faculty members with larger than average teaching loads.
And 55.7 percent of the respondents expressed dissatisfaction with the “effectiveness of academic leadership” at their institution, with 26.6 percent reporting they were “very dissatisfied” on this issue. Judging from some of the related comments, the dissatisfaction arose at least partially from leaders’ handling of the recent financial crisis and its impact on their institutions. But a number of the respondents also pointed to their leaders’ interpretation of family and medical leave policies, and more generally in providing support for their academic careers.
The highest levels of dissatisfaction were aimed at students—with 69.2 percent of the respondents expressing dissatisfaction with their undergraduate students, and 67.3 percent reporting some dissatisfaction with their graduate students. Despite the generally negative impression they had of their students, a majority—albeit a rather narrow majority of 56.6 percent—indicated that the quality of undergraduate education had not declined in the previous 10 years.
Nevertheless, a number of respondents cited poor student quality as an impediment to their own careers. One respondent indicated that career advancement was hindered by a “relatively heavy teaching load,” and declared, “increasingly poorly prepared students have necessitated that I spend ever greater amounts of time on preparing courses, assessment of student work, and remediation of student work in my teaching.”
Despite these concerns, the respondents gave very high marks to their jobs overall, with 41.2 percent reporting they were somewhat satisfied with their jobs, and 46.5 percent reporting they were very satisfied. Only 2.2 percent of the respondents reported they were very dissatisfied.
But looking forward, a number of the respondents expressed pessimism about the future of the discipline. In the words of one, “as I near retirement, my greatest concern is that my younger colleagues will be working on a campus where budgetary cutbacks make it impossible for them to have the experience that I have had.”
Who Were the Survey Respondents?
The respondents reflect the demographics of senior faculty at history departments in 4-year colleges and universities. Among the respondents, 57.5 percent held the rank of professor, and another 41.1 percent held the rank of associate professor. The remainder classified themselves as administrators, emeritus, or not all.
Senior faculty members are still primarily members of the baby boom generation, and 66.7 percent of the respondents were born from 1945 to 1965. Only 14.8 percent of the respondents were born before 1945 and 18.5 percent were born after 1965.
Reflecting the demographics of history departments, women comprised 38.0 percent of the respondents, though their ranks have grown substantially across the generations—rising from 23.3 percent of the faculty members born before 1945 to 43.9 percent of the senior faculty born since 1965. The ethnic composition of the respondents reflects less change, as 89.4 percent of the respondents born before 1945 were white, as compared to 84.6 percent of the respondents born since 1965.
Institutionally, a majority of the respondents (50.9 percent) reported employment at institutions in the U.S. classified as research universities. Another 11.7 percent of the respondents were employed at Baccalaureate colleges, and 22.8 percent were at Master’s level colleges and universities. Of the remainder, 5.1 percent of the respondents were at domestic institutions placed in another category by Carnegie Institution, 7.1 percent were at colleges and universities in Canada, and 1.3 percent did not provide an institutional affiliation.
Robert B. Townsend is the Association’s deputy director and author of History’s Babel(forthcoming from the University of Chicago Press). AHA Professional Division member Sarah Maza (Northwestern Univ.) assisted in the revisions to the survey, and Debbie Ann Doyle, AHA Coordinator of Committees & Meetings, advised on the development of this report. The report benefited from suggestions by the Professional Division and Committee on Women Historians, as well as thoughtful questions and comments from audience members at the session “Celebrations and Lamentations: Achieving and Sustaining Gender Equity in the Historical Profession” at the 2011 meeting of the Southern Historical Association.
This article is the first of two parts. The second part, which deals with issues of gender, will be published in the January 2013 Perspectives on History.
Notes
- We distributed the survey to 7,103 faculty listed as either associate or full professors in the 2010–11 Directory of History Department and Organizations. After eliminating incomplete responses and a few duplicates, we had 2,240 valid responses. The survey instrument was based on a Modern Languages Association survey distributed in 2006, with small modifications by the AHA’s Professional Division and the Committee on Women Historians. [↩]
- Maresi Nerad, et al., Social Science PhDs—Five+ Years Out: A National Survey of PhDs in Six Fields (Seattle, Washington: Center for Innovation and Research in Graduate Education, 2008). [↩]
- Jeremiah P. Ostriker, et al, A Data-Based Assessment of Research-Doctorate Programs in the United States (Washington, D.C., National Research Council, 2010). These rankings received a fair amount of criticism as a flawed ranking of reputation, but for heuristic purposes the broad ranking tiers have proven quite valuable—and as in this case, quite indicative—for differentiating strata in PhD programs. [↩]
- Anthony Grafton and Robert B. Townsend, “The Parlous Paths of the Profession,” Perspectives on History (October 2008), and Karla Sclater, After the Degree: Recent History PhDs Weigh In On Careers and Graduate School (Seattle, Washington: Center for Innovation and Research in Graduate Education, 2008). [↩]
- These responses were very similar to responses from department chairs on the same question. Robert B. Townsend, “A Survey of Tenure Practices in History: Departments Indicate Books Are Key and Success Rates for Tenure High,” Perspectives (February 2004). The findings are also quite similar to findings for the history discipline in the qualitative survey reported in Diane Harley et al, “Assessing the Future Landscape of Scholarly Communication: An Exploration of Faculty Values and Needs in Seven Disciplines,” (Center for Studies in Higher Education, UC Berkeley). [↩]

