Editor’s Note: As detailed in the December 2012 issue of Perspectives on History, the AHA’s 2010 Career Paths Survey solicited valuable information on what contributes to a successful academic career in history. In this issue, we turn to what the survey reveals about the differences and similarities between men and women in the senior ranks.
A number of the respondents to the AHA survey of associate and full professors—both female and male—cited bias against their gender as an impediment to their careers. At a statistical level, the survey provides ample evidence that women and men often take separate journeys to the upper ranks of academia, overcoming their own separate hurdles and reaching different conclusions about their places in the profession.1
Moving through the Ranks
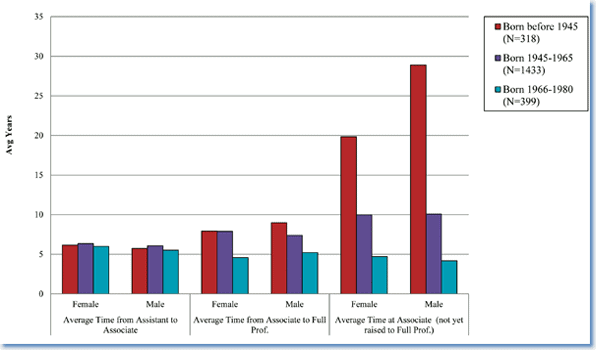
Male respondents reported that they moved slightly faster from the assistant to the associate professor ranks than their female counterparts—averaging 5.9 years from hire to promotion as compared to 6.25 years for women–but historians of both genders moved from associate to full professor at an identical average rate of 7.65 years.
The averages are slightly deceptive, however, as a larger proportion of female historians lingered at the associate rank at the time of the snapshot in the survey. A quarter of the female associate professors (26 percent) hired before 2001 held that rank for eight years or more (longer than the average for promotion), as compared to 16.2 percent of their male counterparts. The gap narrowed significantly among those at the associate professor rank for more than 15 years, as eight percent of the women historians held the rank for 15 years or more, as compared to six percent of men.
The difference between the averages and the lived experiences of large numbers of the respondents points to a significant point of difference between the two genders. While male historians of each generation generally moved through the ranks at a rate close to the average (or not at all), female historians tended to move through the ranks either significantly faster or slower than the average.

Figure 1: Average Number of Years at Rank, by Gender and Age Cohort, 2010
Within the most recent generational cohort (those born after 1965), for instance, women have risen from associate to full professor in an average of 4.6 years as compared to 5.2 years among men (Figure 1). But this group represents only the very earliest members of this generation to reach the highest ranks of the profession.
The shorter time indicated for women in the most recent generation of full professors points to a persistent trend across the two previous generations. In each of the earlier generations, a sizeable portion of the female historians moved through the ranks slightly faster than their male counterparts, but they were counterbalanced in the averages by a large number of women who took longer than the average.
Marriage, Relationships, Family, and Careers
Marital status appeared to be a factor in the time spent moving through the ranks—with marriage correlating to more rapid promotions for men and slower ones for women. Married female historians and those who had been married but were separated, divorced, or widowed at the time of the survey reported that they took an average of 7.8 years to move from associate to full professor. Women who had never married were promoted in an average of 6.7 years. Among men, the full professors who were or had been married received promotion in 5.9 years, as compared to an average of 6.4 years among those who remained single.
Almost twice as many female senior faculty members were divorced or separated at the time of the survey as their male counterparts (11.8 percent of the responding female historians, as compared to 5.6 percent of the men). And 13.5 percent of the female respondents had never married, compared to 4.9 percent of men.
For those who were married or in a committed relationship at the time of the survey, one of the largest differences between male and female members of the profession is in their choice of spouses and partners. Among those who reported a committed relationship, women were significantly more likely to have a spouse or partner with a doctoral degree: 54.7 percent of the female professors in a relationship reported that their spouse or significant other held the PhD, as compared to 30.9 percent of their male counterparts.
It follows that female historians are more likely to have an academic as a spouse or partner. Almost half of the female historians in a relationship (49.6 percent) reported their spouse or significant other was also employed in academia, with 35 percent employed at the same institution and 14.6 percent at another higher education institution. In comparison, only 36.3 percent of the male respondents reported their spouse was similarly employed at a college or university (with 24.3 percent employed at the same institution).
In past surveys and in the comments from a number of respondents to this survey, family responsibilities appear as significant impediments to academic careers. Reflecting the concerns of a number of the respondents, one female associate professor noted that “Having a child means that my second monograph will take longer [due to] child care in terms of time and money.”
Statistically, however, female full professors with children at the time of the survey actually reported moving between the ranks slightly faster than their counterparts without children (moving up in an average of 7.6 years as compared to 7.8 years among the women without children). And a larger proportion of the women without children remained at the associate professor level for 15 years or more (17.5 percent of the respondents as compared to 5.4 percent of the women with children). It is possible the difference can be attributed (at least in part) to the way the question was posed, since it asked about whether children were in the home at the time of the survey, instead of whether the respondent had children of any age.

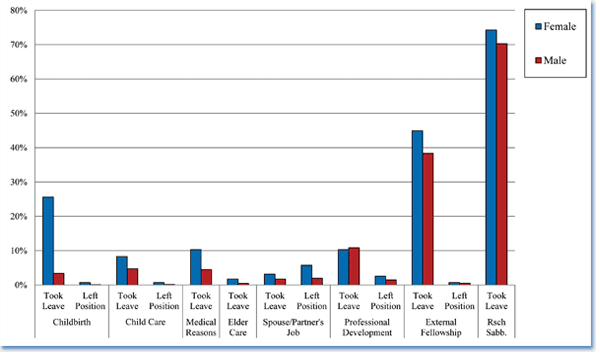
Figure 2: Proportion of Survey Respondents Who Took Leave or Left a Position for Cause, by Gender
Regardless of the time spent moving through the ranks, during the course of their careers female historians were significantly more likely to have taken leave (and in a few cases left their positions entirely) due to a birth or other child care reasons (Figure 2). A quarter of the female respondents (25.6 percent) reported taking leave for the birth of a child, as compared to 3.4 percent of the male faculty. And 8.3 percent of the female respondents reported taking leave for childcare reasons, as compared to 4.8 percent of the men.
Women were also more likely to leave a position in order to support their spouse or partner’s career—with 5.7 percent of the female respondents reporting a resignation for that reason, as compared to two percent of their male counterparts.
Research, Teaching, and Demands on Time
As indicated in the first article on this study, publication was the critical factor for career advancement among both genders. Both women and men at the associate level for more than 15 years had roughly 50 percent fewer books than those who had been promoted. Both male and female faculty reported an average of 1.2 monographs published if they had been at the associate professor level for more than 15 years. That compared to an average of 1.9 books among women who had moved on to professor, and an average of 2.5 among men at the professor rank. (The latter number is skewed upward by the larger proportion of men who have been in the profession for more than 25 years.)
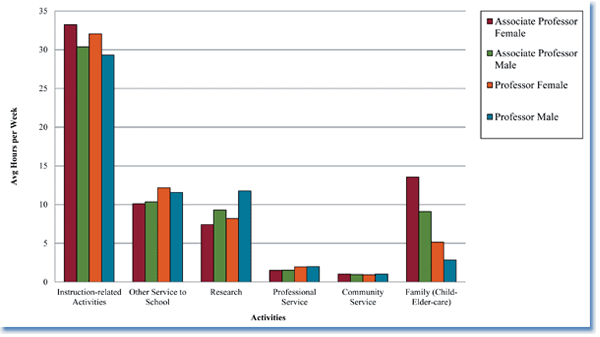
Regardless of the disparity in time to promotion, women historians reported a much larger allocation of time to child and elder care than their male counterparts—an average of 13.6 hours per week at the associate professor level, and 5.2 hours per week at the full professor level, as compared to 9.1 and 2.9 hours respectively among the men (Figure 3).

Figure 3: Average Number of Hours per Week Spent on Academic and Personal Activities
On average, women also allocated about 10 percent more of their time to teaching and instruction-related activities than male historians at both the associate and full professor levels. Female associate professors reported spending an average of 33.2 hours per week on instructional activities as compared to 30.4 hours per week among the male historians. Similarly, at the full professor level, women reported putting in an average of 32.1 hours on instruction, while their male counterparts reported an average of 29.3 hours.
There was very little difference between the genders in the time allocated to institutional, professional, and community service, but male historians reported spending significantly more time per week on research. Women historians reported an average of 7.4 hours at the associate level and 8.2 hours at the full professor rank, as compared to 9.3 hours and 11.8 hours among their male counterparts.
Despite reporting significantly more time on family care, women reported spending roughly the same total amount of time on work and professional activities as men. Both worked an average of about 52 hours per week at the associate level, and 54.5 at the rank of full professor.
There seems to be a rough parity in academic income, as the median for both male and female associate professors was around $80,000, and about $95,000 for full professors. The only substantive difference was in a slightly higher proportion of male full professors who reported earnings over $125,000. But when age was factored in, the gender differences largely disappeared.
Gender and Career Satisfaction
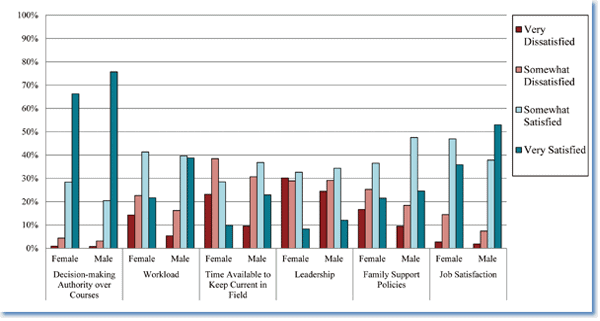
Regardless of rank and income, the female respondents reported much higher levels of dissatisfaction on a range of questions about their instructional duties and jobs (Figure 4). On questions where over 80 percent of faculty of both genders reported being “somewhat” or “very” satisfied with aspects of their jobs—such as decision-making authority over courses, time for class preparation, and job security—both male and female historians were generally in accord.
But on questions where at least 10 percent of the male respondents indicated some level of dissatisfaction, women reported significantly higher levels of dissatisfaction. For instance, when asked about the time available to keep current in their field, 61.6 percent of the female historians expressed dissatisfaction, as compared to 40.3 percent of the men. And 20.6 percent of the women historians expressed dissatisfaction with their opportunities for job advancement in their institution, as compared to 11.8 percent of men.

Figure 4: Levels of Satisfaction with Various Aspects of Job, by Gender
The differences cannot be attributed solely to women historians who have hit a glass ceiling in the department. The responses from faculty who have been at the associate professor rank for longer than average were fairly close to the observations from faculty who either had already been elevated or were still at an earlier stage in their careers.
The greatest problem seemed to reside in departmental cultures perceived as reflecting an “old boys network.” One respondent reported that “a department culture that valued ‘civility’ was used as a way of silencing female professors with ideas about new ways of getting things done.” And another respondent noted a “lack of an institutional culture that supported academic mothers.”
This gap in perceptions appeared most clearly around a set of questions about whether “Female faculty members are treated fairly at this institution.” While 84.7 percent of the male respondents agreed with that statement, only 55.4 percent of the female respondents concurred (and 10.6 percent strongly disagreed).
These concerns also arose in a set of questions about why the respondents might seek employment at another institution. Female professors were much more likely to indicate the environment of a department and its gender balance as significant considerations. While 40.5 percent of the women respondents cited gender balance in the department as very important, only 17.2 percent of the male respondents said the same.
The wide disparities in satisfaction levels are consistent with a long line of previous surveys sponsored by the Committee on Women Historians and the AHA’s Professional Division, which have highlighted the ongoing challenges for women seeking to balance work and family life and offered recommendations for redressing some of the particular challenges female historians face in pursuing an academic career in history.2
AHA Professional Division member Sarah Maza (Northwestern Univ.) assisted in the revisions to the survey, and Debbie Ann Doyle, AHA coordinator of committees & meetings, advised on the development of this report. The report benefited from suggestions by the Professional Division and Committee on Women Historians, as well as thoughtful questions and comments from audience members at the session “Celebrations And Lamentations: Achieving and Sustaining Gender Equity in the Historical Profession” at the 2011 meeting of the Southern Historical Association.
Notes
- The original survey and this analysis rely heavily on an MLA survey, summarized in “Standing Still: The Associate Professor Survey, Report of the Committee on the Status of Women in the Profession” (New York: Modern Languages Association, 2009). See also Robin Wilson, “Why Are Associate Professors So Unhappy?” Chronicle of Higher Education (June 3, 2012). [↩]
- See for example Elizabeth Lunbeck, The Status of Women in the Historical Profession (Washington, D.C.: American Historical Association, 2005); and Committee on Women Historians, Gender Equity in the Academic History Workplace: A Guide to Best Practices. [↩]

