The latest salary data from the College and University Personnel Association (CUPA) offers mixed news for historians, as salaries for historians in academia are falling further behind the other disciplines.1 While the salary data is disappointing, the report suggests good news in the history job market, pointing to a significant increase in the number of new assistant professors hired in history departments last year.
The CUPA salary figures are based on a 9- or 10-month academic year salary for faculty working over 51 percent time. The figure does not include fringe benefits, perquisites, and other outside income like summer employment. The CUPA survey is the only national report that provides salary data on specific disciplines. Unfortunately, it divides the data into separate surveys of private and public institutions, and does not differentiate between different types of degree-granting colleges and universities.
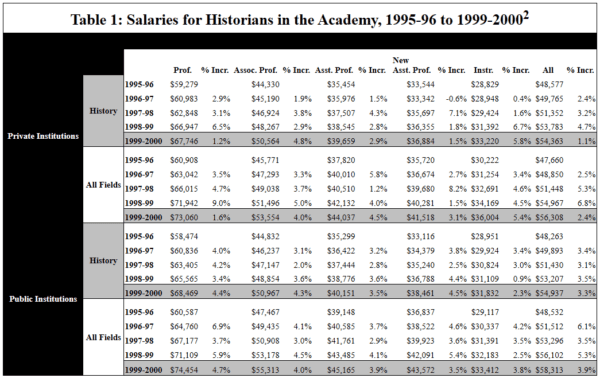
Table 1
The CUPA surveys for 1999–2000 found that the average salary for historians at private colleges and universities rose to $54,363—a scant 1.1 percent increase. When compared to last year’s 2.7 percent increase in the cost of living, this news seems particularly disappointing. For the first time in three years, the average salary for historians at public institutions saw a stronger increase, rising 3.3 percent to $54,937. However, these aggregate trends are slightly deceptive. As the rank-by-rank data demonstrates (Table 1), the overall averages are being held down by the replacement of senior faculty with lower-salaried junior faculty (c.f. Figure 3). Faculty at most ranks in public institutions are doing well above the average (and well above the increase in the cost of living). In addition, three of the four continuing faculty ranks at private institutions managed to surpass the rate of inflation.
As the data in Table 1 indicates, the aggregate data does point to some real differences in the salary adjustments for history faculty. After a sizable 6.5 percent increase for full professors at private institutions the previous year, the new survey found their salaries rising an anemic 1.2 percent. In contrast, salaries for full professors at public colleges and universities maintained a more even pace of growth, following up 4.2 percent increases with 3.4 percent growth.
Similarly, salaries for newly hired assistant professors showed an equally disparate trend. Newly hired assistant professors at private institutions received only 1.5 percent more on average than last year’s hires. This was the second year in a row in which the increase over the prior year was less than two percent. In contrast, new assistant professors at public institutions saw a 4.5 percent increase over the hires of the previous year. This marked the fifth year in which new hires at these institutions received at least 2.5 percent more than their predecessors.
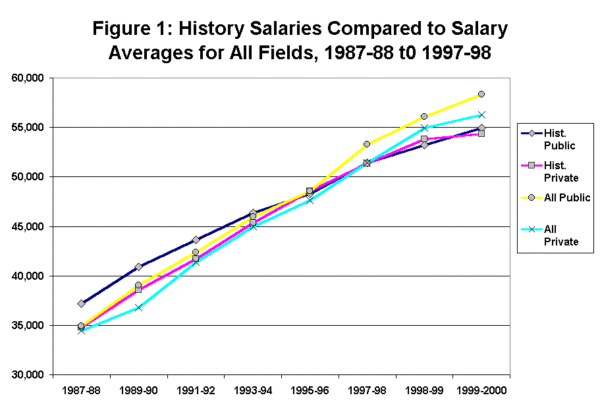
Figure 1
Perhaps the most troubling aspect in the survey is the growing evidence that history is lagging behind other disciplines in average salary. As indicated in Figure 1, the gap between the average salary for history faculty and the average for all disciplines has grown over the past three years. Historians did almost 2 percent better than the average just four year ago, and have now fallen 3.6 percent behind. And while historians at private institutions were a half percent behind the average four years ago, that gap has now grown to 6 percent.
The CUPA surveys do not provide salary data on the growing number of part-time faculty employed in history departments. However, the AHA conducted two surveys during the summer that will provide some information on this. An analysis of these results will appear in next month’s Perspectives.
Mixed News from the AAUP
A much wider salary survey by the American Association of University Professors (AAUP) found a similar 3.6 percent increase in average salaries for faculty at public and private institutions, as well as two-year colleges (which are excluded from the CUPA survey).2
Salary increases were smallest at two-year colleges, rising by just 2.5 percent. Faculty at baccalaureate and MA-granting “comprehensive” colleges fared marginally better, averaging 3.3 and 3.4 percent increases, respectively. Not surprisingly, faculty at PhD-granting institutions continue to fare better, averaging 3.9 percent over the previous year.
Unlike the CUPA surveys, the AAUP report does not provide discipline-specific information, but it does take into account all forms of compensation, including fringe benefits and summer wages.
According to the AAUP, the average faculty salary in higher education is $58,352, with an average of $14,070 in additional benefits and compensation (including insurance, retirement, Social Security, and tuition). For ranked faculty, the highest average salaries were in doctoral programs, where faculty average $66,991 with $16,164 in additional benefits. The lowest average salaries were at two-year institutions where salaries average $46,484 with an additional $12,178 in
benefits.
Significant Improvement in Junior Hirings
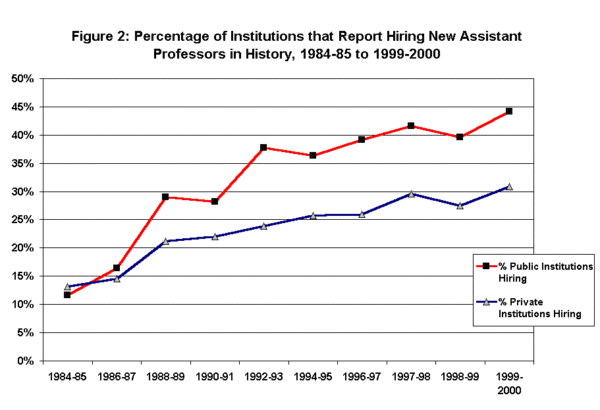
Figure 2
After a disturbing dip in the hiring of new junior history faculty evidenced in the 1998–99 CUPA surveys, the number of new assistant professors reported hired last year increased sharply (Figure 2). New assistant professors in the CUPA taxonomy include all those hired to, or promoted to, the assistant professor rank in the fall of 1999.
The proportion of history departments hiring new assistant professors rose dramatically from 27.7 in the fall of 1998 to 44.8 percent last year, and the number of new assistant professors hired rose to 345 from 277 the year before. These mark the highest marks for each since the CUPA surveys began in 1986 (Figure 4). Indeed, the previous highs were reached just two years ago, when almost 30 percent of the departments reported the hiring of 296 new assistant professors.
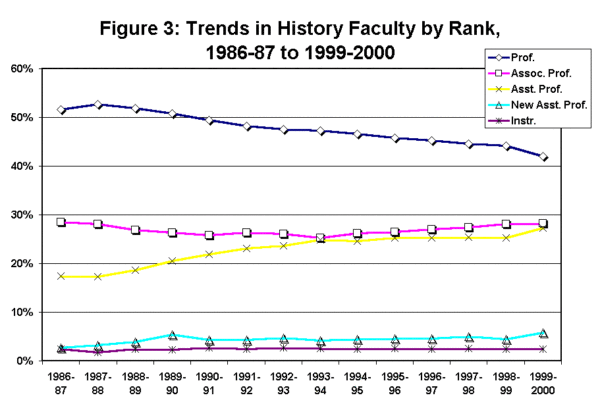
Figure 3
This reinforces AHA data reported earlier this year, which tracked an increase in the number of new assistant professors hired in the last edition of the Directory of History Departments.3 The data in the CUPA surveys also support evidence that these openings are being produced by a growing number of retirements from the top ranks, as the proportion of full professors of history continues to fall (Figure 3). Just five years ago, the authors of the CUPA report sighted history as one of the most top-heavy disciplines the academy. While still well above the average (full professors account for 33 percent of all faculty at private institutions compared to 42 percent of history faculties; the comparison is 37 percent to 42 percent at public institutions), the proportion of upper level faculty has been declining at the rate of 2 to 3 percent a year since 1996.
While this marks a significant improvement in the job market, the numbers of new hires are still lagging behind the numbers of new PhDs being produced, which reached 988 in 1998.
Growing Salary Gap in History
Even though aggregate salary adjustments at public institutions have been more equitable between the ranks, the gap between historians at the highest ranks and the lowest has become more acute. At public colleges and universities the highest paid history professor made more than 13 times the salary of the lowest paid instructor ($149,127 compared to just $11,400). The gap between the highest and lowest paid history faculty at private institutions is significantly smaller, as the highest paid history professor received seven times the salary of the lowest paid history instructor ($157,650 compared to just $22,500).
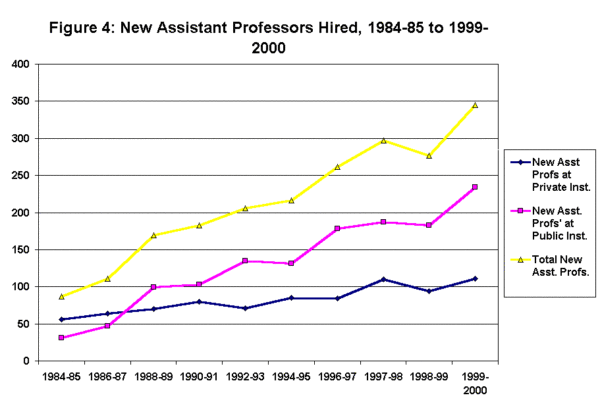
Figure 4
This gap has grown sharply over the past 10 years, particularly at public institutions where the disparity more than doubled. In 1989–90, the salary of the highest paid history professor at public colleges was five times as much as the lowest paid historian ($75,600 as compared to $15,000).
The difference between historians at different ranks has grown less dramatically at private institutions, in large measure because the salary disparities typically were larger. In 1989–90, the highest paid history professor made 5.5 times as much as the lowest paid instructor ($84,200 as compared to $15,000).
Notes
- CUPA, National Faculty Salary Survey by Discipline and Rank in Private Colleges and Universities (published annually for the academic years 1986–87 through 1999–2000), and CUPA, National Faculty Salary Survey by Discipline and Rank in Public Colleges and Universities (published annually for the academic years 1986–87 through 1999–2000). Salary figures are based on a nine- or ten-month academic year, full-time faculty only. Fringe benefits and summer earnings are excluded. Copies can be obtained from CUPA at 1233 20th St., NW, Ste. 301, Washington, DC 20036-1250. (202) 429-0311. [↩]
- American Association of University Professors, “More Good News, So Why the Blues,” Academe 86:2 (March–April 2000). Copies can be obtained by contacting the AAUP at 1012 14th St., NW, Ste. 500, Washington, DC 20005. (202) 737-5900. [↩]
- See Robert B. Townsend, “Job Market Report 1999: Significant Improvement in Job Openings,” Perspectives (November 1999), 3. [↩]

