For those who follow the job listings in Perspectives, it will come as no surprise that the supply of jobs improved markedly in the 1998–99 academic year. Listings in the Employment Information section of Perspectives rose 11 percent above the year before, offering the most opportunities in over 10 years. The total number of job listings (including fellowships paying $25,000 or more per annum) increased significantly last year, as the overall number of jobs listed rose to 779 from 704 advertisements in the 1997–98 academic year.
However, an analysis of faculty listings in the Directory of History Departments and Organizations found that new openings are just barely keeping up with a growing number of retirements. In fact, the sharp increase in job listings translated into a scant 0.6 percent increase in faculty at the 587 U.S. history departments listed in the directory over the past four years.
To some extent, this divergence between the rising number of job offerings and the fairly static number of employed historians occurred because openings for junior faculty have improved at a more modest pace than job offerings overall. The number of jobs advertised for lecturers or assistant professors rose 8 percent from the year before, and the proportion of junior faculty jobs fell to its lowest level in 3 years, comprising just 78 percent of the jobs advertised.
This apparent lag in the growth of junior faculty jobs was due in part to a rise in the number of fellowships advertised—which increased from 33 to 40—as well as a slight jump in the number of positions advertised outside the academy—which rose from 19 to 24. But the biggest change occurred in the number of job listings for senior historians.
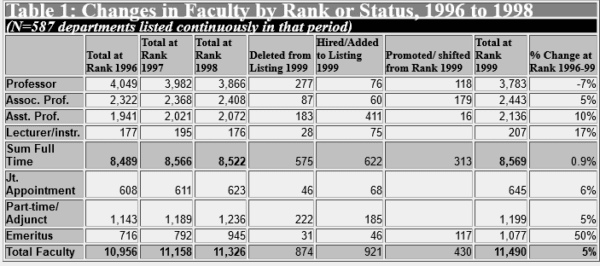
 There is evidence in both the job advertisements and in the changes to listings in the Directory of History Departments that a growing number of departments are seeking to replace senior faculty with historians at a comparable level. The number of job openings advertised for senior historians only (associate or full professors) rose 24 percent. In examining changes to the listings in the Directory, staff found a significant increase in the number of senior historians switching departments (Table 1). Almost one-third (32 percent) of the senior historians who left their departments last year shifted to another department. This is in striking contrast to the figure three years ago of just under 25 percent. The statistical evidence is supported anecdotally by reports from senior historians, who report a marked increase in recruitment efforts, and by department chairs like Gail Stokes (Rice Univ.), who observed that there appeared to be “more movement at the non-junior level than at any previous time in my 30 years in the profession.”
The long-term significance of this trend is impossible to measure, but the department chairs consulted agreed that this will not present a net loss to the profession. Citing his department’s recent experience, J. William Harris (Univ. of New Hampshire) noted that “new openings at the senior level should, with a bit of time lag, eventually result in more openings at the entry level when all departments are considered as a whole.” The data from the Directory bears this out, as no correlation could be found between the hiring of senior faculty and a commensurate reduction in junior faculty hiring. Indeed, the dominant factor was the overall improvement or stagnation of hiring in a particular region or type of institution.
Solid Improvements in Most Areas for Junior Faculty
The news on junior faculty openings is quite positive overall. The 8 percent increase in jobs available to new PhDs kept pace with recent growth in the number of new PhDs. Equally important, the proportion of tenure-track jobs has remained steady at just over 81 percent.
 Moreover, growth in junior faculty listings occurred in every region of the country except the West. Increases in new openings were particularly strong in the Southeast, which enjoyed growth of 24 percent over the prior year, but the Northeast, Southwest, and Midwest also posted solid gains of between 6 and 12 percent. In the West, California, Oregon, and Idaho had modest gains in the number of jobs listed, but these were more than offset by declines in postings from Washington, Hawaii, and South Dakota (Table 2).
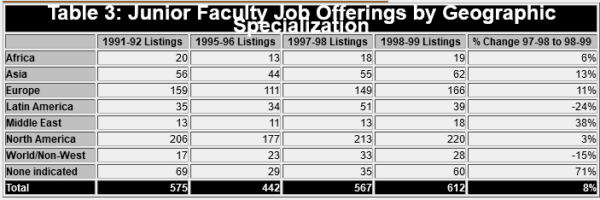
There was a similar improvement in most of the geographic specializations. Every field except Latin America and world history enjoyed some improvement over the prior year, led by the Middle East, which posted 38 percent growth over the prior year, and Asia, which saw listings increase by 13 percent. Job listings for Europe and North American specialists had more modest gains of 9 and 3 percent respectively. In the case of Latin American and world history, the declines, while significant, follow a number of years of solid growth in each category.
 The Association has been tracking job openings since the academic job market began its decline in 1991–92.1 Comparing the latest numbers with those from 1991–92 reveals the dramatic increase in the number of jobs offered. As Table 3 indicates, offerings for junior faculty jobs in every field except Africa have rebounded strongly, and now surpass the number of offerings in 1991.
At the same time, the proportion of tenure-track job listings has also improved dramatically. Only 71 percent of the junior faculty jobs listed in 1991–92 were advertised as tenure track. Tenure-track positions have comprised 81 percent of the listings for the past two years.
Demographics in the Departments
For comparative purposes, the AHA has also been quantifying changes in the faculty listed in the Directory of History Departments (Table 1), and drew data from 587 departments that have listed in the Directory for each of the last four years. The data for this year’s volume supports recent evidence that a generational shift is now taking place in history departments, and also points to divergent hiring policies depending on the type and location of the institution.
Even with increasing department switching at the senior level, the “emeritus faculty” category remains the fastest-growing segment of the faculty. This past year alone, 163 historians shifted to emeritus status, accounting for almost 2 percent of all the faculty listed. Just four years ago, the College and University Personnel Association noted the relatively high proportion of full professors in history departments when compared to the rest of the academy.2 Since that time, the number of full professors in history has fallen 7 percent. Further, a growing number of retirements from the ranks of associate professors in history is concealed in the data by an increasing number of promotions to that rank.
This growing number of retirements has created significant opportunities for new PhDs to enter the academy. This past year the departments in the study added 476 new assistant professors and lecturers, up from 412 the year before. Of the new hires at the junior faculty level, 69 percent either were PhD candidates or had received their PhD in the last two years.
However, when the data is viewed regionally, some important differences from the trends in the job listings emerge. Most notably, despite significant gains in the number of jobs advertised in the Northeast over the past three years, the number of full-time faculty actually fell 0.4 percent between 1996 and 1999. The difference arises from the larger number of faculty employed in the Northeast (31 percent of all full-time faculty). The increased hiring reflects an effort—not entirely successful—to keep pace with the growing number of retirements. In contrast, departments at other regions have had greater success in replacing their retiring seniors, and the number of full-time faculty at departments in other regions grew between 1 and 1.8 percent.
Similar disparities emerge when changes are considered according to the type and location of the institution. Over the past four years the growth in full-time faculty employment occurred primarily in private liberal arts colleges. The number of full-time faculty at private institutions of all kinds grew 2.7 percent between 1996 and 1999, while departments that confer the BA as their highest degree enjoyed 2.1 percent growth over the same period. In contrast, the full-time history faculty at public colleges and universities grew only 0.1 percent over the same period, while departments that confer graduate degrees grew by just over 0.5 percent.
Intriguingly, the number of part-time faculty listed in the new Directory dipped slightly from the year before. This figure has increased steadily for the past 15 years, so the change is notable. Public colleges and universities led the decline, losing 5 percent of the part-time faculty from the previous year’s listing.
Despite the change, part-time faculty still account for more than 10 percent of the faculty listed in the Directory, a figure that understates the actual number of part-time faculty by around 62 percent.3 Given the traditional undercounting of part-time faculty in the Directory, it is still unclear whether this represents a change in the way the listings are submitted, or a real drop in the number of part-time faculty. The AHA will be sending out the annual department survey as well as a separate survey of part-time faculty later this fall to seek further answers.
Notes
- Susan Socolow (Emory Univ.), “Analyzing Trends in the History Job Market,” Perspectives (May/June 1993). [↩]
- CUPA, National Faculty Salary Survey by Discipline and Rank in Public Colleges and Universities 1995–96, vii. [↩]
- Robert B. Townsend, “1998 Job Market Report: Retirements Create More Opportunities but Job Gap Remains,” Perspectives (January 1999): 3. [↩]

