Figure 1
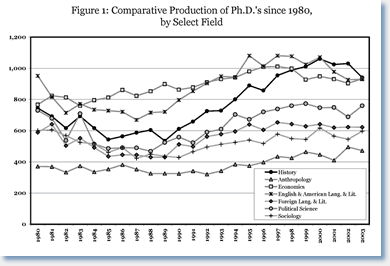
History PhDs conferred in the 2002–03 academic year fell almost 9 percent from the year before, as 153 universities reported that they granted 940 history doctorates, down from 1,030 (Figure 1). This marks only the fourth decline in the number of new history PhDs since 1988. The top 15 universities conferring history PhDs accounted for more than one-third of the doctorates in the field.
This data comes from the most recent federal Survey of Earned Doctorates, conducted by the National Opinion Research Center (NORC), which provides the most accurate and detailed information on new PhDs, as well as demographic details about who is receiving the degree, how long they spent working toward it, and their immediate employment plans and prospects.1 The multidisciplinary survey data also allows us to compare history to other disciplines conferring PhDs.
By many measures, the news in the latest report is troubling. The time spent working toward the history PhD, for instance, grew longer and now surpasses every other discipline. Among the new cohort of history PhDs, the time spent registered for graduate courses increased, from an average of 9 (in 2001–02) to 9.3 years. In comparison, the average for all fields was 7.5 years. Given the extended time spent working toward the degree, it is hardly surprising that the average age of new history PhDs increased by two-tenths of a year, to 34.9 years—a year-and-a-half older than the average for new PhDs in all fields. It should be noted, however, that the figures given for “time spent registered for graduate courses” are slightly deceptive in that they are precisely that—they include time spent on any study following the undergraduate degree and not just for the PhD.
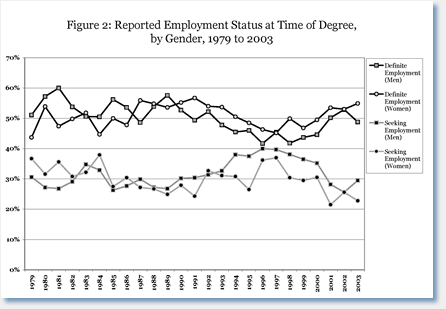
Despite their years of effort, the new PhDs reported declining success in finding employment after they received the degree. The proportion of new history PhDs who reported “definite employment” fell from 52.9 percent to 51.3 percent—reversing three years of improvement. This is still well above the low point of 44.9 percent in 1998–99, but it does fit with our reporting on the declining number of jobs being advertised.2 Among the rest, 26.8 percent of the new history PhD recipients reported they were still seeking employment when they received the degree, while 14.3 percent planned to take or seek a postdoctoral fellowship, and 7.7 reported that they were uncertain about their future.

Figure 2
Beneath the broad trend, there was a marked gender difference (Figure 2). The proportion of female history PhDs reporting employment at the time of their degree rose slightly—from 53 to 54.9 percent—while among men, the percentage reporting definite employment fell from 52.9 to 48.8 percent. This gap was also reflected among those still seeking employment, as 29.5 percent of the men said they were actively pursuing jobs (up from 25.6 percent) as compared to 22.8 percent of women (which was down from 25.6 percent).
The proportion of women and minorities in the cohort of new history PhDs was largely unchanged. Women comprised 40.1 percent of the degree recipients (up from 40.0 percent), while minorities comprised 13.2 percent (up from 12.1 percent) of the new history PhDs. In contrast, women comprised 45.2 percent of the PhDs conferred in all disciplines, while minorities comprised 19.1 percent.
Trends among Fields and Subfields

Figure 3
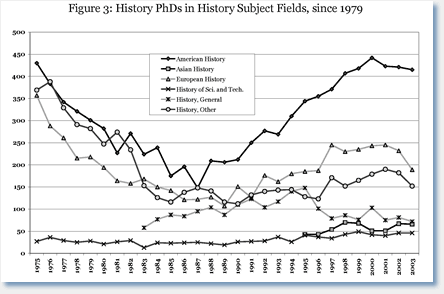
Perhaps the most significant shift in the NORC data lies in the growing predominance of specialists in the field of American history (Figure 3), even though the categories used for history are quite problematic—with three geographical categories for America, Europe, and Asia; one thematic category for the history of science; and two amorphous categories for “general” history and “other history.” Nevertheless, the divergence between American and European history over the past 25 years is quite marked. Since 1975, European history has declined from 30.2 to 20.1 percent of the PhDs conferred, while American history has grown from 36.3 to 44.1 percent of the PhDs conferred.
In absolute terms, the number of history PhDs in American history grew almost 300 percent from 148 PhDs in 1987 (its lowest point in the past 30 years) to a peak of 442 in 2000, before slipping back to 415 in 2003. In comparison, European history grew more modestly, from a low of 107 PhDs in 1989 to a peak of 245 in 1997, before falling back to 189 in the latest report. Since the Asian history category was introduced with the 1995 report, the number of PhDs in that field has grown from 41 to 66 of the reported degrees, rising to almost 7 percent of the new history PhDs.
While these trends are suggestive, they should be viewed with caution. Historians working on other regions of the world are obviously being folded into the broad categories of “general” and “other” history, which accounted for 7.7 percent and 16.2 percent of the new PhDs. We also know from our analyses of dissertations reported to the Directory that these amorphous categories also include a number of PhDs in American and European history.3
However, the comparative data for other disciplines is less ambiguous. The total number of PhDs conferred increased 1.9 percent, as 423 universities granted 40,710 doctorates. This meant in turn, that the number of history PhDs declined relative to all other fields, falling from 2.6 to 2.3 percent of all PhDs conferred (although this was still well above the discipline’s representation a decade ago, when history accounted for just 1.8 percent of the new PhDs). History also declined relative to the other humanities fields as well, falling from 19.2 percent to 17.4 percent of the humanities degrees conferred. While the language and literature fields held steady, fields like music, art history, and philosophy all grew sharply. Meanwhile, a number of related social science fields—economics, sociology, and political science—all grew last year (Figure 1). Nevertheless, as that figure demonstrates, history experienced the sharpest increase in the number of PhDs conferred through the 1990s. Thus, even with the decline from the previous year, history is still producing more PhDs than almost every other field outside of education and engineering.
Financing the Degree
The report also provides some useful data on the amount of debt taken on in the pursuit of the doctorate, although not specifically for the field of history. Among the new cohort of humanities PhDs, 18.2 percent had accumulated more than $35,000 in debt in the course of their graduate studies, while slightly more than half (52.9 percent) reported they had acquired no new debts in the course of their graduate studies. The average humanities PhD student finished his or her studies with an additional $11,143 in debt (up from $10,893 the year before). Only social science PhDs accumulated more debt in the course of their studies.
When borrowing for undergraduate studies is factored in, more than a third of the new humanities PhDs finished their educations with more than $20,000 in school-related debts, while barely 40 percent finished debt free. In comparison, among all fields exactly half of the new PhDs finished their studies without debt, while 27 percent had borrowed more than $20,000.
Most humanities PhDs did, however, benefit from some institutional support. Just over 73 percent of humanities PhDs reported that a fellowship or scholarship paid for some of the costs of their studies, while 82 percent benefited from a teaching assistantship.
Notes
- T. B. Hoffer, L. Selfa, V. Welch Jr., K. Williams, M. Hess, J. Friedman, S.C. Reyes, K. Webber, and I. Guzman-Barron, Doctorate Recipients from United States Universities: Summary Report 2003 (Chicago: National Opinion Research Center, 2004). Note that the number of PhDs reported in this federally sponsored tabulation tends to be around 9 percent higher than the number we tabulate annually from the “dissertations completed” listings in the Directory of History Departments. The federal report includes PhDs completed in specialized departments that do not list in the Directory, and since the categories are self-selected, this also includes PhDs from departments in other fields and disciplines. [↩]
- See Robert B. Townsend, “Job Market Report 2004,” Perspectives43:1 (January 2005), 13–19. [↩]
- Robert B. Townsend, “Job Market Report 2001: Openings Booming … but for How Long?” Perspectives 40:9 (December 2001), 5. [↩]

