In 2001, the number of history jobs in academia reached its highest point in 30 years, as a continuing wave of senior faculty retirements opened new opportunities for junior historians and recent PhDs. However, even as job openings appear likely to increase over the short term, there are some caution signs. A survey of recent PhDs indicates that despite the recent growth in job openings less than half of all history PhDs will find employment in the academy. Despite these poor placement rates, PhD-granting history departments are focusing on the increasing job ads and appear poised to increase graduate admissions.
Job Listings Hit 30-Year High
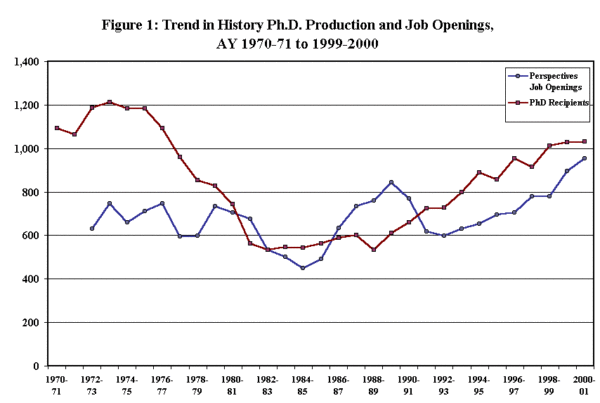
Figure 1
Job openings in Perspectives increased for the fifth time in a row in the past academic year, posting the largest number of history jobs since the Association began advertising jobs in the 1971 (Figure 1). Openings for junior faculty (at the instructor or assistant professor level) increased 11.3 percent over those in the 1999-2000 academic year, from 719 to 800 openings. The total number of job listings (including openings limited to senior scholars, nonacademic positions, and fellowships offering more than $25,000 per year) rose a more modest 5.9 percent to 955 from 897 openings the year before.1
In addition to the faculty positions available to new and recent PhDs, another 47 offerings were postdoctoral fellowship positions, which offered generous stipends, but obviously no long-term job prospects.
Tables 1 and 2 demonstrate the recent dramatic improvement in the number of jobs offered to junior faculty, as the total number of openings is now 81 percent above its low point in 1995-96. However, the growth last year was somewhat uneven, with strong gains in the Northeast and Southeast offset by near stagnation in the West, and a decline in job openings offered overseas and in the Southwest (Table 1).
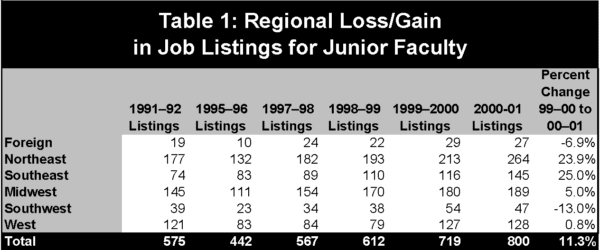
Table 1
There was a similar unevenness in the major field specializations (Table 2). Job listings for specialists in Africa, Asia, Europe, and the world surged between 17 and 25 percent. Openings in North American history-which comprise more than a third of the history jobs and PhDs-grew a more modest 3.1 percent. The only geographic field to post a decline was in Latin American history, which fell back to the same number of ads as two years ago.
Given concerns about the way staff sometimes tabulate ads in a particular field, staff also analyzed the job listings to assess all of the field specializations requested in a particular advertisement. As reflected in Figure 2, this allows us to offer information on a wider range of field specializations, particularly thematic fields. It will come as no surprise that more ads mention cultural history than any other thematic field, appearing in 21.6 percent of the listings.
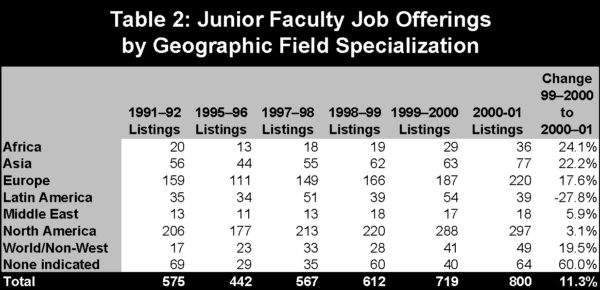
Table 2
The most troubling note is a continuing decline in the proportion of offerings that state they are tenure track. While the total number of tenure-track jobs has risen steadily over the past five years, from 466 in 1996-97 to 597 last year, the proportion has fallen from 84.5 percent to 74.6 percent. This may merely indicate an excess of caution in today’s litigious society, as much of the change has occurred in elite schools whose ads have become mute on the subject of tenure. Only 8.8 percent of the junior faculty jobs specified that they were short-term one- or two-year appointments.
PhD Production Leveling Off, But Still Growing
Despite the recent dramatic gains in openings, the lines of supply and demand have not yet converged (Figure 1) because the production of PhDs continues to grow. However, the number of new PhDs listed in the new Directory of History Departments (covering the 2000-01 academic year) rose a scant 0.3 percent over the year before, supporting evidence that the recent growth in PhDs is leveling off. At the same time, the number of history dissertations reported to the Association as “in progress” declined 2.5 percent to 3,840-the second annual decrease and the smallest number since the Association began systematically collecting this information in 1997-98.
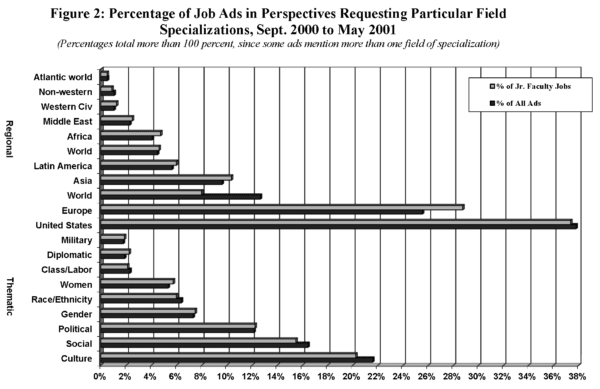
Figure 2
Last year PhD-granting history departments reported 11,611 “actively enrolled” graduate students in their programs, down 13.5 percent from the peak of 13,429 in 1995. The decline has come entirely from the full-time student population, which fell to 9,281 students from 9,937 the year before. The number of part-time students rose slightly to 2,330 students from 2,242.
PhD-granting history departments have been cutting back on graduate student admissions since the job crisis became readily apparent five years ago. Unfortunately, since the completion of a history PhD takes an average of about eight years, the drop in new admissions has been slow to reverse the rising production of new PhDs.
However, the data reported to the Directory suggest that the departments have noted the recent improvements in the job market, and are looking to increase admissions to their graduate programs.
Given the improvements in the job market, for the first time in six years a plurality of PhD programs reported that they hope to increase graduate-student admissions, with programs estimating an average increase of 4 percent. This move is led by larger PhD programs (departments that have produced an average of nine or more PhDs over the past five years), who estimated they would increase graduate admissions to the program by an average of 6.4 percent. Smaller programs (departments that produce an average of three PhDs or less) indicated they would like to increase admissions by only 2.3 percent. This disparity is even more evident when measured by the U.S. News & World Report reputation surveys, as the top 25 history programs plan to increase admissions by an average of 9.2 percent.2
Placement Rates Remain Disappointing
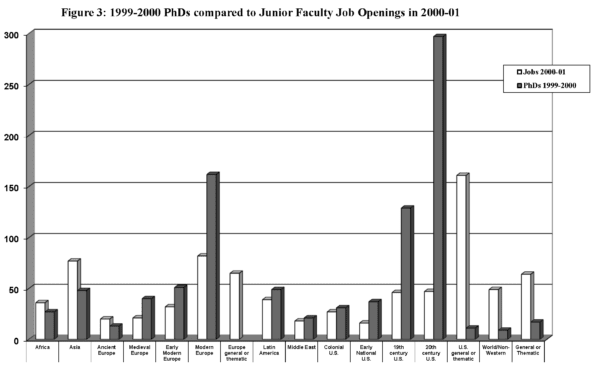
Figure 3
This effort to increase admissions seems premature due to low placement rates and significant imbalances in the field specialists being produced. A survey of the 1999-2000 cohort of history PhDs indicates a sharp imbalance between the field specializations of new PhDs and the available jobs (Figure 3), which carries through into placement rates in the academy (Figure 4).
To get a better handle on how the increases in job openings are being translated into placements for new history PhDs, staff analyzed the list of history PhDs received in 1999-2000 (as reported in last year’s Directory of History Departments) and tabulated them according to the field of specialization of their dissertations. Almost one-third of the PhDs were in 20th-century U.S. history (297 of 942 listed), and another 17 percent were in modern European history. These differ markedly from the field specializations being sought in ads for junior faculty. Only 47 advertisements sought a specialist in 20th-century U.S. history, and only 82 ads sought a specialist in modern Europe. As Figure 3 indicates, there was a number of additional openings for thematic specialists in U.S. and Europe, which would be open to the surfeit of specialists in these fields.
However, the intense competition for these jobs is evident in the number of applications and placement rates for specialists in these fields. In a survey of job advertisers two years ago, these were among the very few fields to report a net increase in the average number of applications per position.3 Those advertising 20th-century U.S. history positions reported receiving an average of 133 applications for each job opening-up 6 percent from a similar survey conducted four years before. Similarly, there were over 101 applicants for modern Europe jobs, up 11 percent from the earlier survey.
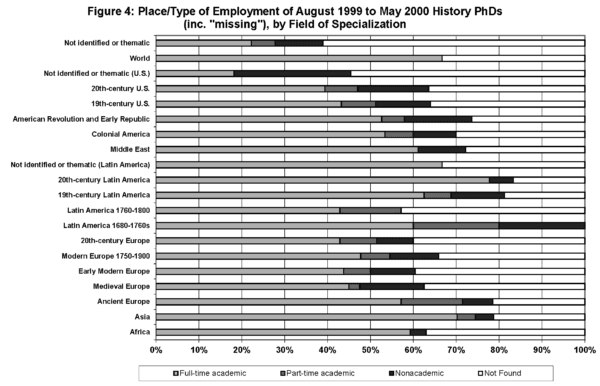
Figure 4
To assess how this translated into the placement of history PhDs, staff compared the list of 1999-2000 history PhDs to the faculty listed in the most recent Directory and on the web sites of 250 smaller colleges and universities that do not list in the Directory.4 The findings, presented in Figure 4, highlight the highly differential character of employment and the large number of history PhDs who did not find employment in a school with a substantial history program. Less than half of the 1999-2000 cohort of history PhDs could be identified as having full-time academic employment, as 46 percent had full-time academic jobs, 7 percent were employed in part-time positions, and another 13 percent were employed outside the academy.
Once again, 20th-century U.S. history PhDs seem to be suffering the worst of the job crisis, as only 39 percent could be identified as finding full-time academic employment, while 48 percent of modern European history PhDs found full-time jobs in the departments reviewed.
Viewed more broadly, receipt of a PhD from even the most prestigious programs provides no guarantee of jobs. The top 25 programs in the U.S. News rankings placed only 54 percent of their PhDs into full-time academic employment, though this is certainly better than the 38 percent placement rate among the other 75 programs on the list.
Retirements Likely to Sustain Job Production
Despite the problems of placement, the current elevated number of job openings appears likely to continue through the end of the decade. We currently estimate that about 21 percent of the full-time history faculty are in their late 50s and early 60s, and approaching retirement. As a result, the number of job openings seems likely to remain at its present elevated rate, as history faculty who entered the academy in the late 1960s and early 1970s leave their posts.
For comparative purposes, AHA staff converted the faculty listings in the AHA directories prepared at five-year intervals from 1975 through 2000. The findings highlight the large number of faculty who entered the academy between 1964 and 1974, as a sharp increase in undergraduate enrollments from the Baby Boom generation created unprecedented opportunities for history teachers.5 In fall 1975 the cohort of PhDs produced in the previous 10 years accounted for half of the full-time history faculty employed in colleges and universities in America.
Despite the recent wave in retirements and hiring, we estimate that 28 percent of the full-time faculty members in history departments are approaching the age at which they are likely to retire.6
In addition to creating opportunities for the large numbers of history PhDs being produced annually, this is also producing the most significant generational shift in 30 years. Given the significant turnover of the past four years reflected in the large cohort of faculty who received their degree since 1990, and the likelihood that it will continue, it seems likely that by the end of this decade over half of the historians teaching in colleges and universities will have received their degrees since 1990.
A Few Dark Clouds behind the Silver Lining
Recent events have somewhat clouded this rosy picture, as the effects of the recent economic downturn and the September 11 attacks threaten to close off a number of job lines, and perhaps increase the pressure to hire more part-time faculty.
A survey of history department chairs nationwide found that state programs from Florida to California are already dealing with modest budget cuts this year, and many more have been told to prepare for cuts ranging from 1 to 15 percent next year. Over 62 percent of the responding history programs at state institutions said they have been told to prepare for cuts, and another 9 percent have had budget constraints imposed upon them. In comparison, only 15 percent of the programs at private institutions said they were facing budget cutbacks. All but two of the programs are continuing with hires that were already underway-and a few programs said they were actually accelerating the hiring process to complete them before a hiring freeze could be implemented.
A number of department chairs suggested that these trends would play into the increased use of part-time faculty in the profession in one of two ways. Some programs with imminent retirements expressed concern that they would only be able to hire a part-time faculty person as a replacement. However, two departments which did not foresee any imminent openings suggested that they could only meet the budget reductions by releasing their part-time faculty.
Applications Declining
The news from the department chairs was not all bad for job seekers. A number of department chairs noted that the number of applicants for their openings were either down markedly from past hires, or at least well below expectations.
As we noted in January, the number of applicants for a wide range of fields started to decline about two years ago as the production of PhDs and the number of history jobs began to converge. However a closer analysis of the complaints suggests that the concerns tend to be focused on very specific areas-supporting the evidence in Figure 3. Departments with openings in 20th-century (or “recent”) U.S. history or modern European history seemed quite pleased with the number of applications. However, a number of departments singled out openings in Asian history (especially Japan and China) and colonial-era American history as eliciting significantly fewer applicants than expected. A number of thematic specializations were also noted, particularly African-American and imperial history.
In addition to the shortfall in specific subjects, a handful of department chairs also noted that they were having increasing difficulty finding and hiring part-time and adjunct faculty. And at the other end of the hiring spectrum, six departments complained that they were finding it increasingly difficult to recruit senior historians. It remains to early to tell however, whether these concerns reflect a reduction in the pool of surplus history PhDs and a settling of the movement of mid-level and senior historians.
A number of the chairs cited additional reasons for the apparent drop in applicants, ranging from general disgust with the job market and aspects of it like the Job Register, to misguided notions that a late application will receive more notice than one that arrived early-two chairs said such applications would certainly be noticed, albeit right into the rubbish bin.
Despite the decline in overall numbers, almost all of the chairs reported that they were quite satisfied with the pool of applicants they had received. And speaking from the perspective of a graduate advisor, Jean Soderlund of Lehigh University said this was all to the good: “I see the shift in the job market balance [toward the candidate] as only good news. Perhaps universities will start offering new history PhDs better working conditions, full-time positions, benefits, and better salaries.”
Notes
- The Association has been categorizing the field specializations for job openings since the academic job market began its decline in 1991-92. See Susan Socolow, “Analyzing Trends in the Job Market,” Perspectives (May/June 1993) and Robert B. Townsend, “Academic Job Opportunities Better than Expected in 1997,” Perspectives 36:6 (October 1997): 9. [↩]
- See Robert B. Townsend, “A Hierarchy of History Programs: The U.S. News & World Report Rankings,” Perspectives (April 1998). [↩]
- Robert B. Townsend, “Odds for Applicants Improving,” Perspectives (January 2001), Table 2. [↩]
- This review obviously leaves out a substantial number of two-year programs and smaller 4-year programs, but should account for almost all of the programs with more than three history faculty in the department or school. [↩]
- This is discussed in greater detail in Robert B. Townsend, “The Job Crisis of the 70s,” Perspectives (April 1997). [↩]
- For almost three decades now history PhDs have received their PhDs at a median age of 33. Given that, we projected a career of roughly 35 years in the academy. Information on retirements described in Courtney Leatherman, “End of Mandatory Retirement Has Little Effect on College Faculties So Far, Economists Say,” Chronicle of Higher Education, 20 May 1998, A1. Data on median ages of history PhDs from the annual Summary Report: Doctorate Recipients from United States Universities (published annually National Research Council until 1997, by the National Opinion Research Center 1998 to 2000). Data on the relative age and retirement plans of historians are supported by data in the 1999 National Study of Postsecondary Faculty recently released by the National Center for Education Statistics. The latter study will be explored in greater detail in next month’s Perspectives. [↩]

