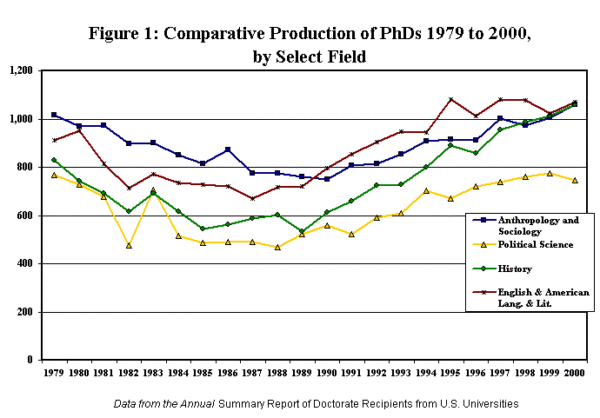
History PhD production rose faster than every other field and discipline over the past 10 years, rising 73 percent while the overall growth was only 15 percent. The National Opinion Research Center (NORC) reports that 1,060 history PhDs were conferred in 2000—up from 1,011 the year before and 611 in 1990.1
Only the production of PhDs in the health sciences came close to the pace of history PhDs, increasing by 65.5 percent over the past decade. The two closest humanities and social science fields were English language and literature and political science, with growth of around 34 percent (Figure 1).

Figure 1
Nevertheless, the upward trend in history PhDs appears to have flattened out. In 1999–2000, the total number of doctorates produced at U.S. institutions rose 0.8 percent to 41,368, while history PhD production rose 0.4 percent—only the second time in the past decade that history PhDs lagged slightly behind the overall trend in PhD production. PhDs listed in the most recent Directory of History Departments (covering the 2000–01 academic year) increased only slightly, and the number of history dissertations reported to the Association as “in progress” declined 2.5 percent to 3,840—the second annual decrease and the smallest number since the Association began systematically collecting this information in 1997–98. PhD-granting history departments reported that in 2000–01 the number of “actively enrolled” graduate students in their programs was 11,611, down 13.5 percent from the peak of 13,429 in 1995.2
PhD-granting history departments have been cutting back on graduate student admissions since the job crisis became readily apparent about eight years ago. In the late 1980s and early 1990s there was a great deal of optimism about the history job market, and even talk of a coming “PhD shortage” by the decade’s end. As a result, admissions of new graduate students to history PhD programs shot up 60 percent between 1984 and 1992. Following the recession of 1992, with a growing disparity between PhDs produced and the number of job openings, history departments began to cut back on graduate student admissions. Admission of new graduate students to history PhD programs dropped 22 percent since its high point in 1992, to just 2,481. Unfortunately, since the completion of a history PhD takes an average of about eight years, the impact of the drop in new admissions is not yet perceptible.
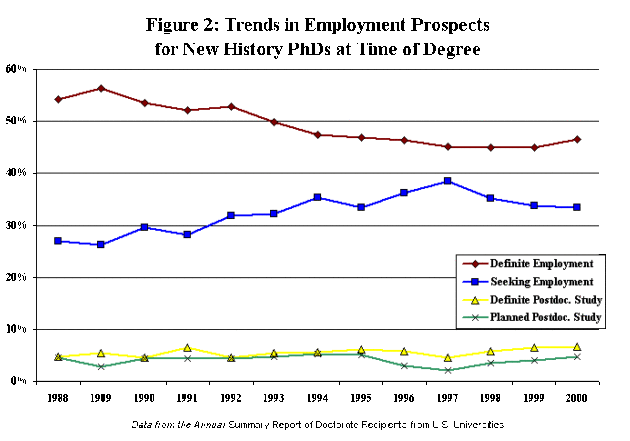
The report contains other positive indicators. Most notably, the number of new history PhDs with definite employment when they received their degree rose 3.6 percent—the first such increase in nine years (Figure 2). With one exception, the proportion of new history PhDs reporting “definite employment” at the time they received their degree has declined steadily each year since 1989, when 56.3 percent of the students reported they had a job in hand. In 2000, that figure stood at only 46.5 percent, but rose from a low of 44.9 percent, where it had been stuck for two years.
Demographics of the New PhD Cohort
The demographic data on the new PhDs offer rather mixed evidence for those concerned about the level of diversity in the profession. The representation of minority historians among the new cohort of PhDs increased slightly, rising to 12.4 percent of the U.S. citizens receiving history doctorates—up from 11.6 percent the year before. However, the proportion of women declined to 38.3 percent of the history PhDs conferred in 2000—down from 39.6 percent in 1999, and well below the high point of 41.3 percent in 1996.
These proportions continue to lag behind representation of women and minorities among PhD recipients generally. Minorities received over 18 percent of the PhDs conferred in all fields in 2000, and women received 43.8 percent of the new PhDs. The representation of women is particularly striking when compared to other humanities and social science fields. Women received 50.2 percent of the doctorates in all humanities fields (which includes history) and 54.5 percent of degrees conferred in the social sciences.

Figure 2
The time spent working toward the degree remained essentially the same, as PhD recipients reported they had spent an average of 9 years registered for graduate courses, and received the PhD an average of 11.3 years after completing their baccalaureate degree. Likewise, the average age of the new PhDs was essentially unchanged, as the median age of the new history PhDs was 34.6 years. These figures are all significantly higher than the average for PhD recipients in all fields, where the median time spent registered for courses was 7.4 years, the median time since the baccalaureate degree was 10.3 years, and the median age was 33.6 years.
The survey also provides information on the primary source of financial support and debt accumulated in the course of doctoral study. Unfortunately, the survey does not provide data specifically on the history field but includes history under data for the broad field of humanities. The study reports that a plurality of doctorate recipients in humanities (38.3 percent) had paid out of their own pocket. However, 33.2 percent had been able to fund most of their studies with teaching assistantships, and 23.8 percent had funded their education with fellowships and dissertation grants.
Given the large proportion of humanities doctoral students receiving significant amounts of financial assistance, it is perhaps unsurprising that 40.4 percent completed their studies without any debt. However, more than half of the humanities PhDs had accumulated debt of $5,000 or more, and 17.9 percent finished their degrees more than $30,000 in debt.
Notes
- Thomas B. Hoffer et al., Doctorate Recipients from United States Universities: Summary Report 2000 (Chicago: National Opinion Research Center, 2001). [↩]
- This was explored in greater detail last month in Robert B. Townsend, “2001 Job Report: History Openings Reach New Heights,” Perspectives (December 2001), 7. [↩]

