Figure 1
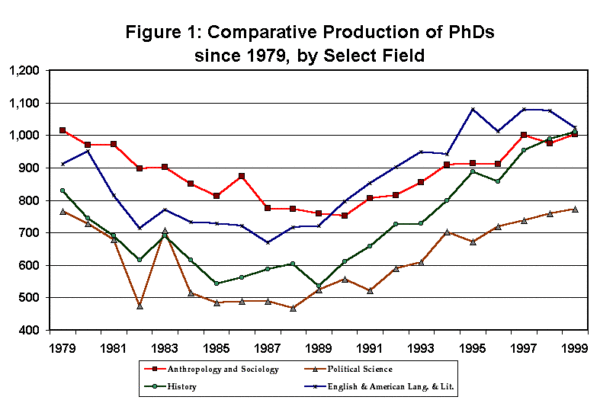
The nation’s history programs produced more than 1,000 new PhDs in 1999—the largest number since the mid-1970s—according to a recent national survey of PhD production. The data, collected for five federal agencies by the National Opinion Research Center (NORC), indicates that 1,011 history PhDs were conferred in 1999—up from 988 the year before.1
The rise in the production of history PhDs contrasts with a decline in the overall production of PhDs, as the number of new PhDs in all disciplines fell 3.6 percent from 1998 to 1999—the largest one-year decline in almost 25 years. However, these declines occurred predominantly in the fields of engineering and physical science, where prospects for employment without the PhD are far better.
In the humanities and social sciences, most of the fields saw small increases in the number of new PhDs (Figure 1). English was one of the few humanities fields to show a decline in PhD production, dropping from 1,076 new PhDs in 1998 to 1,024 in 1999, bringing the field to near parity with the history field, after producing significantly more PhDs every year since 1989.
Demographics of the 1999 PhD Cohort
The representation of minority historians among the new cohort of PhDs increased slightly, rising to 12 percent of U.S. citizens receiving history doctorates—up from 11.8 percent the year before. The proportion of women also showed a small gain, rising to 39.6 percent of the history PhDs conferred in 1999—up from 39 percent in 1998, but still below the high point of 41.3 percent in 1996.
These proportions also continue to lag behind representation of women and minorities among PhD recipients generally. Minorities received almost 16 percent of the PhDs conferred in all fields in 1999, and women received 42.5 percent of the new PhDs. The representation of women is particularly striking when compared to other humanities and social science fields. Women received 48.9 percent of the doctorates in humanities fields (which includes history) and 54.5 percent of degrees conferred in the social sciences.
The 1999 cohort of history PhDs spent an average of 9 years registered for graduate courses—up from 8.6 years in 1998—and received the degree an average of 11.3 years after completing their baccalaureate degree. Given this extended time of study, it is not surprising that the median age of the new history PhDs was 34.8 years. These figures are all significantly higher than the average for PhDs in all fields, where the median time spent registered for courses was 7.3 years, the median time since the baccalaureate degree was 10.4 years, and the median age was 33.8 years.
The survey also provides information on the primary source of financial support and debt accumulated in the course of doctoral study. Unfortunately, the survey does not provide this data specifically for the history field (in this section, history is included in the broad field of humanities). The study reports that a plurality of doctorate recipients in humanities (39.4 percent) had paid out of their own pockets. However, 32.8 percent had been able to fund most of their studies with teaching assistantships, and 23.5 percent had funded their education with fellowships and dissertation grants.
Given the large proportion of humanities doctoral students receiving significant amounts of financial assistance, it is perhaps unsurprising that 41.3 percent completed their studies without any debts. However, more than half of the humanities PhDs had accumulated debts of $5,000 or more, and 15.5 percent finished their degrees more than $30,000 in debt.
Employment Prospects for New PhDs

Figure 2
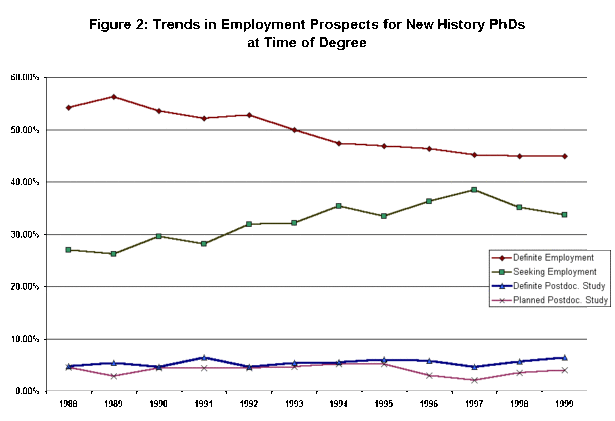
The NORC survey shows some early signs of improvement in the history job market. The study indicates a halt in the seven-year decline in the number of history PhDs reporting “definite employment” at the time of degree, as the figure held steady at 44.9 percent (Figure 2). However, this figure remains well below the level of a decade ago, when 56.3 percent of the new PhDs reported they had already secured employment when they received their degree.
At the same time, the proportion reporting that they were still “seeking” employment when they received their degrees fell for the third year in a row, down to 33.7 percent from a high of 38.5 in 1997.
However, these apparent improvements may be reflecting changing attitudes and expectations among recent recipients of the history PhD. The number of new history PhDs planning on employment in the academy fell to a new low in 1999, with only 57.7 percent reporting plans for employment in an educational institution. Another 10.4 percent reported that they plan to pursue postdoctoral study, which is very near its highest level in 20 years.
Ten years ago, 64.5 percent of new history PhDs planned on employment at an educational institution. That figure peaked at 68.6 in 1992, but then declined steadily as the job market for historians in academia turned grim.2
Notes
- NSF/NIH/NEH/USED/USDA, Survey of Earned Doctorates, Prepublication Tables for the Summary Report 1999: Doctorate Recipients from United States Universities, February 2001. In 1997, NORC took over data collection from the National Research Council, which had conducted the survey since 1977. [↩]
- For more on employment trends and enrollments in history PhD programs, see Robert B. Townsend, “Job Market Report 2000: History Job Openings Continue to Surge,” Perspectives (December 2000): 3. [↩]

