The supply of history jobs in the academy continued to improve last year, as listings in the Employment Information section of Perspectives rose 15.3 percent above those in the 1998-99 academic year, and more than half of all U.S. history departments listed in the Directory reported hiring new junior faculty. Both of these trends mark the best rates of new hiring in over 10 years. When combined with evidence of a coming reduction in the number of new history PhDs on the job market, the trends are exceptionally positive. There remains, however, the troubling issue of the continuing growth in the number of part-time and adjunct faculty.

The total number of job listings in Perspectives (including fellowships paying $25,000 or more per annum) rose to 897 from 779 advertisements in the 1998-99 academic year. The number of job listings has increased more than 35 percent over the past four years. Supplementary data from the Directory of History Departments indicate that these openings are translating into growth in the number of full-time faculty, and a significant generational shift as senior faculty retire and are replaced by new assistant professors (See Table 1).
Solid Improvements in Most Areas for Junior Faculty
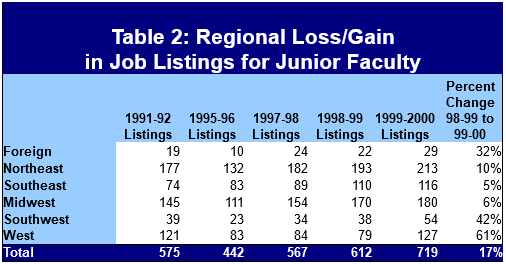 Listings for positions available to new PhDs (ads stating that they were seeking someone at the lecturer or assistant professor level) rose 17 percent over the year before. Comparison to the data from the past eight years (Table 2 and Table 3) clearly demonstrates the dramatic improvement in the number of jobs being offered, as the total number of offerings is now 63 percent above its nadir in 1995-96.1
Equally positive, the growth in junior faculty listings was strong in every region of the country, rising from 5 percent in the Southeast to over 61 percent in the West. The sharp increase in openings in the West is particularly notable, since that region has lagged behind the rest of the country in job creation for almost 10 years. (Table 2).
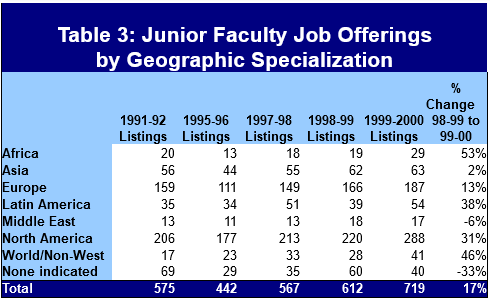 There was solid improvement in most of the major field specializations as well (Table 3). Job listings for the fields of European and North American history-which produce the most new PhDs-posted solid gains of 13 and 31 percent respectively. Offerings in the field of African history grew 53 percent over the prior year, while offerings in Asian history increased by 2 percent. The only geographic field to post a decline was that of Middle East history, but even there the 6 percent decline in openings came on the heels of a 38 percent increase last year.
In addition to the faculty positions available to new PhDs, another 54 offerings were postdoctoral fellowship positions, which offered generous stipends, but obviously no long-term job prospects.
The only troubling note in the job listings is a small drop in the proportion of offerings that are tenure track. After comprising 81 percent of the junior faculty listings for two years, that proportion fell to 77 percent. It is worth noting that this is still well above the proportion in 1991-92 (when the Association began tabulating this data) when 71 percent of the junior faculty jobs listed were advertised as tenure track.
Retirements Produce New Openings
The recent increase in job offerings is predicated on the long-anticipated retirements of historians who entered the academy in the 1960s, and a growing number of retirees who received their degrees in the early 1970s. For comparative purposes, the AHA measured changes in 599 departments listed in the Directory of History Departments for each of the last three years. The data for this year’s volume supports recent evidence that a significant generational shift is now taking place in history departments. As Table 1 demonstrates, the number of full and associate professors that left their departments or switched to emeritus status has been growing over the past few years, rising almost 14 percent (from 361 in 1998 to 411 this summer).
Even with a certain amount of department switching at the senior level, the “emeritus faculty” category remains the fastest-growing segment of the faculty. This past year alone, 187 historians shifted to emeritus status-2 percent of the full-time faculty listed. At the same time, the total number of full professors has declined almost 9 percent since 1997. There has been a similar decrease in the ranks of associate professors, but this has been largely masked by a growing number of promotions to that rank.
Growing rates of retirement created a significant number of opportunities for new PhDs to enter the academy. Indeed, the increased hiring of new junior faculty has closely paralleled the retirements from the senior ranks. The departments in the study added 568 new assistant professors and lecturers, up from 500 the year before.
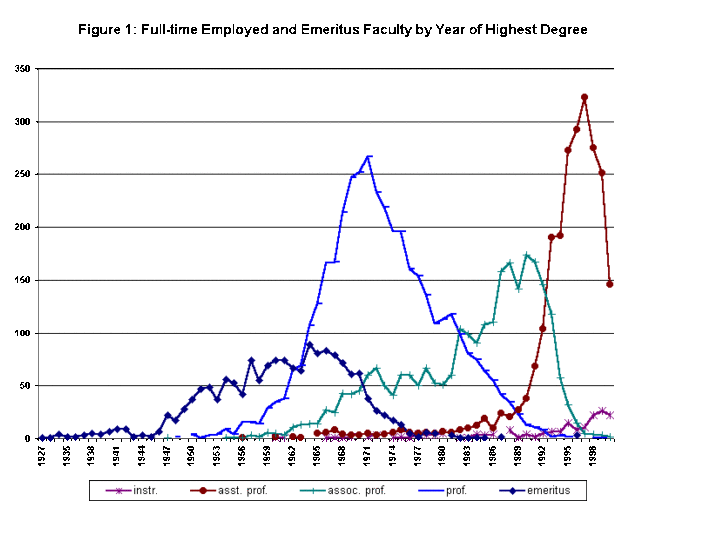 This trend is likely to continue given the large number of potential retirees. A comparison of the years that emeritus faculty and full professors received their degrees (Figure 1) supports the notion that a significant number of faculty will soon retire. This past year, 73 percent of the full and associate professors who left their departments or switched to emeritus status received their degrees between 1961 and 1973. Even with the recent retirements, historians who received their PhDs between those years still account for almost one-third of the full-time employed faculty listed in the new Directory. Given that the median age of a new history PhD has long been around 33, this represents a large cohort entering their 60s.
Equally notable is the large number of retirees who received their PhDs between 1970 and 1983 (almost 27 percent), since they would only be in their late 50s and early 60s. This finding supports a recent study that suggests the end of the mandatory retirement age has been counterbalanced by an increased number of early retirements encouraged by the recent growth in the stock market and retirement funds.2
Further Signs of Easing Job Crisis
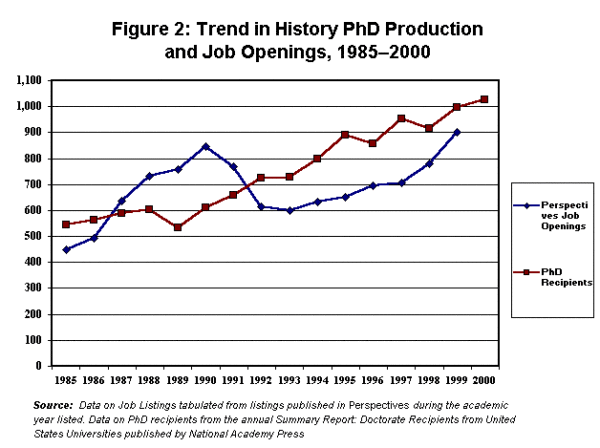 The improvements in the number of job openings is clearly narrowing the gap between the number of new PhDs produced and the number of jobs available (Figure 2). While the gap has not closed, there is growing evidence that the history job market is becoming more competitive for employers, and also providing more opportunities for history PhDs who received their degrees during the depths of the job market crisis.
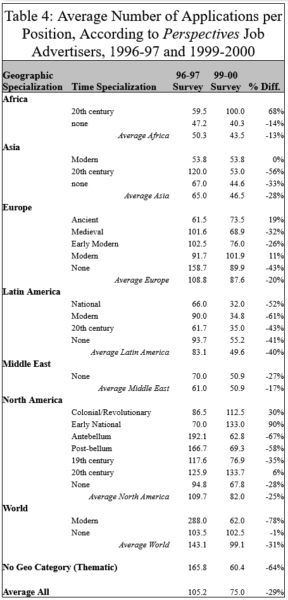
The Association surveyed the 897 advertisers in Perspectives last year to ascertain how many applications they received for their jobs, and whether the position was filled.3 Search committees reported the average number of applications received for jobs in different geographic fields of history have declined from 13 to 40 percent in the past three years (Table 4). Jobs listed in the history of North America, for instance, received an average of about 82 applications per job, down from an average of over 109 in a similar survey three years ago. Applications for jobs in Latin American history and Asian history are down over 30 percent from the previous survey, averaging 50 and 45 applications per opening respectively. The averages for European, African, and Middle Eastern history declined significantly, but not quite as fast. The number of applications for positions in European history fell 19 percent, to 88 per opening, while applications for African history openings fell 13 percent, to an average of almost 44 per job.
 The data from the Directory provide further evidence other evidence of an easing of the job market, as departments appear more willing to hire junior faculty who are three or more years from their PhD. Traditionally, the ideal window of opportunity for landing a tenure-track job is at the ABD stage or within two years of receiving the PhD-around 70 percent of the new hires in past four years were within this range. However, this past year the proportion of new junior faculty hires who were either PhD candidates or had received their PhD in the last two years fell below 64 percent.
Similarly, the survey of search committees also suggests that a growing number of job candidates have the leisure of being more selective in the job offers they accept. Over 4 percent of the respondents reported that the advertised position was not filled because their first (and in some cases the second and third) choices declined the offer. This is up from the 1997 survey, in which less than 2 percent of the positions went unfilled because the chosen candidate had declined the offer.
PhD Production Hits New High
The number of new PhDs listed in the new Directory of History Departments (covering the 1999-2000 academic year) rose 3 percent over the year before, and follows an 11 percent increase the prior year. As Figure 2 indicates, the supply of new PhDs is the crucial factor in the continuing shortage of jobs. Even as the number of job openings climbed to unprecedented levels over the past few years, the number of PhDs managed to grow at nearly the same pace.
However, the data from the departments indicates that PhD production has hit its peak and will soon decline. Notably, the number of history dissertations reported to the Association as “in progress” fell to 3,938-the first decrease and the smallest number since the Association began systematically collecting this information in 1997-98.
PhD-granting history departments have been cutting back on graduate student admissions for about five years, but since the completion of a history PhD takes an average of over eight years, the drop in new admissions has been slow to reverse the rising production of new PhDs. Last year departments reported 12,179 “actively enrolled” graduate students in their programs, down 9.3 percent from the peak of 13,429 in 1995. That total is composed of 9,937 full-time and 2,242 part-time enrolled graduate students.
Smaller PhD programs (in Doctoral I and II universities in the Carnegie system of classification) led the decline by cutting the number of graduate students by more than 10 percent, and in some cases by canceling the program altogether over the past two years. In comparison, larger programs (at Research I and II universities) have cut graduate student admissions by about 5 percent.
Given the improvements in the job market, for the first time in six years a plurality of PhD programs reported that they hope to increase graduate student admissions to their program in the fall of 2000 (in the early summer departments are asked to estimate how many graduate students they plan to admit in the coming term). This anticipated increase amounts to just one percent overall, and departments of every size and in every region projected a small increase.
Changing Trends in Field Specializations
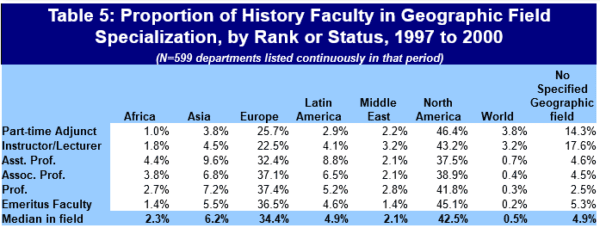 Figure 1 illustrates the dramatic generational shift now taking place in history departments, as those who received their PhDs since 1990 now account for more than a third of all full-time faculty. A crosstabulation of faculty listed in the Directory by field specialization supports the notion that this trend has been accompanied by different priorities in the types of specializations that are being sought. Notably, the proportion of junior faculty employed to teach European history is clearly smaller than that of their senior colleagues, while the proportion of junior faculty teaching in fields outside Europe and the United States is noticeably larger (Table 5). A similar disparity emerges in the crosstabulation between faculty who received their doctorates before 1980 and those who received the PhD between 1990 and the present.4
When the data is tabulated to include data on field specializations of the faculty, the gradual expansion of teaching positions for fields outside the United States and Europe is put into relief. When the field specializations of the cohort of potential retirees (those who received a PhD between 1961 and 1973) is compared to those of recent PhDs (PhD received between 1991 and 2000) there is notable decline in the number of specialists in European and North American history. Specialists in European history accounted for 37 percent of the 1961-73 cohort, and only 31 percent of the 1990-2000 cohort. North American history specialists from the 1990-2000 cohort were represented in the same proportion as the earlier cohort, but were significantly more likely to be employed in a part-time or adjunct capacity than any other field. Even though North American history specialists account for 41 percent of the total faculty, they represent 47 percent of the part-time faculty.
The proportion of specialists employed in the fields of African, Asian, and Latin American history are significantly higher in the younger cohort of PhDs. Specialists in African history comprised 2 percent of the 1961-1973 cohort, and 4 percent of the 1990-2000 cohort. Similarly, Asianists comprise 6 percent of the older cohort and 9 percent of the recent PhDs, while Latin Americanists have risen from 5 to 8 percent.
This corresponds to data from AHA’s annual survey of history departments. The departments reported an 8.5 percent decline in the number of faculty employed to teach European history between 1989 and 1999. Faculty employed to teach U.S. history had remained essentially unchanged, and faculty teaching about all other areas of the world had risen over 10 percent.5
Rising Number of Part-Time Faculty
A continuing point of concern is the unabated growth of part-time and adjunct positions. Among department listings in the Directory, the growth in the number of part-time faculty has been second only to the growing number of emeritus faculty. In the new edition of the Directory, the number of part-time faculty listed increased 7 percent over the previous year. This sharply reverses last year’s findings, in which the number had dropped 3.5 percent (the first drop in the 15 years staff had tracked this data).
 Similarly, the number of full-time nontenure-track faculty is also growing. The most recent AHA survey of history departments found a net loss in the number of full-time tenure-track faculty, as only 205 tenure track faculty were hired to replace 231 lost (Table 6). This finding suggests that the net growth indicated in the number of full-time faculty (Table 1) came from the hiring of new full-time nontenure-track faculty.
For additional information on the use and treatment of part-time and adjunct faculty, see Robert B. Townsend, “Part-Time Faculty Surveys Highlight Disturbing Trends.”
Notes
- The Association has been categorizing the field specializations for job openings since the academic job market began its decline in 1991-92. See Susan Socolow, “Analyzing Trends in the Job Market,” Perspectives (May/June 1993): 1 and Robert B. Townsend, “Academic Job Opportunities Better than Expected in 1997,” Perspectives (October 1997): 9. [↩]
- Courtney Leatherman, “End of Mandatory Retirement Has Little Effect on College Faculties So Far, Economists Say,” Chronicle of Higher Education (May 20, 1998): A1. [↩]
- Survey sent to all 897 advertisers, and received responses from 453 search committees or departments responded-an additional 35 responses were received after the deadline. These additional responses were added into the tabulation a 46.5 percent response rate. This survey will be analyzed in greater detail in the January 2001 issue of Perspectives. [↩]
- Faculty specializations are tabulated from a database of all faculty listed in the AHA’s Directory of History Departments and Organizations, 2000-01. Faculty without specific geographic areas of specialization were excluded from the count. Faculty with more than one geographic specialization were counted in the first field listed. [↩]
- Data on the survey reported last month in Robert B. Townsend, “AHA Data Indicates Surge in Number of History Majors and Continued Growth in Undergraduate Enrollments,” Perspectives 38:8 (November 2000): 3. [↩]

