During the 1996–97 academic year, salaries for history faculty at public colleges and universities grew faster than those of their colleagues at private institutions, and even managed to exceed the rate of inflation, according to recent surveys. This marks a significant reversal in recent trends for the history profession.
For the previous four years, historians’ salaries at public institutions had failed to keep pace with national cost of living or salary increases for historians at private institutions, and the gap between historians at public and private institutions had narrowed to insignificance. While the intramural comparisons may appear positive for history faculty at public institutions, the news is decidedly mixed, as their salaries fell below the average for other disciplines for the first time in 15 years.
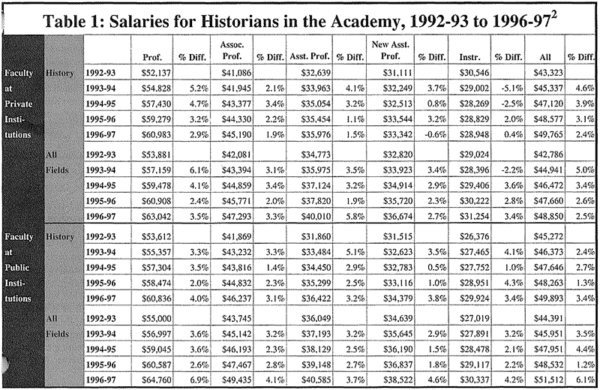
Table 1
New studies by the College and University Personnel Association (CUPA) found that during the 1996–97 academic year the average salary for historians at state colleges and universities rose to $49,893—a 3.4 percent increase. The average salary for historians at private institutions saw a more modest increase of 2.4 percent, raising the average salary to $47,646.1 When set against a 3.3 percent increase in the national cost of living, this translates into a real decline in history salaries at private institutions of 0.7 percent. And while the growth in salaries for historians at public institutions was slightly above last year’s inflation rate, it can hardly be deemed a great success. After years of stagnation, the average salary for all disciplines in public colleges and universities surged 6.1 percent last year, according to the CUPA survey.
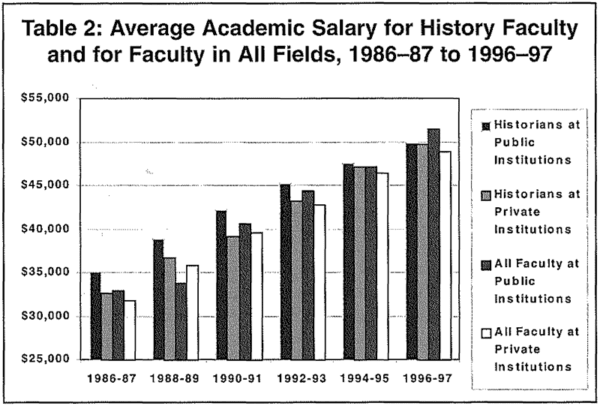
Table 2
The relative decline in salaries for historians at public colleges and universities is best indicated in the comparison to the average for other disciplines (Table 1).2 Ten years ago, the average salary for historians at public colleges and universities was $2,225 above the institutional average for all disciplines. In the most recent CUPA survey, history salaries had fallen $1,619 below the average. And while the average salary for historian’s at public institutions fell almost 2 percent relative to inflation over the past ten years, the average for all fields rose 10 percent faster than inflation (Table 2).
It has long been taken for granted that history faculty at public institutions could expect to be paid better than their counterparts at private institutions. However, as state legislators curtailed the funding of state institutions and salaries at private institutions kept pace with inflation, the gap between average salaries for history faculty at public and private institutions had fallen to just $95. Last year’s salary adjustments increased that gap only slightly, to an average of $128.
And while the average salary for historians at private institutions appears higher than that in all fields combined, this is largely due to the demographics of the history discipline. At every rank the average salary for historians is below that of their counterparts in the other fields, but the combined average for history is skewed higher by the predominance of faculty at the top ranks—almost 46 percent of his tory faculty at private institutions are full professors, as compared to 31 percent in the faculty at large.
Looking back at Table 1, it is also notable that there was a much more equitable distribution of salary increases among the ranks of history faculty at public institutions. Full professors received only a slight 0.2 percent advantage in salary adjustments over new assistant professors at state institutions. By contrast, full professors at private institutions took home an average 2.9 percent more in salary last year, while salaries for new assistant professors fell 0.6 percent in real terms.
A More Pessimistic Report from the AAUP
A much wider salary survey by the American Association of University Professors (AAUP) offers a more pessimistic assessment than CUPA. The AAUP indicates that the average compensation for all faculty rose only 3 percent—a real decline of 0.3 percent against inflation. Unlike the CUPA surveys, the AAUP report does not provide discipline-specific information, but it does take into account all forms of compensation. According to the AAUP, the average faculty salary in higher education institutions is $51,436, with an average of $12,436 in additional benefits (including insurance, retirement, Social Security, and tuition).
According to the AAUP report, when compared to other professions requiring advanced degrees, salaries for the academy trailed the other professional groups by 37.8 percent as of 1994.
Hiring Patterns and Changing Demographics
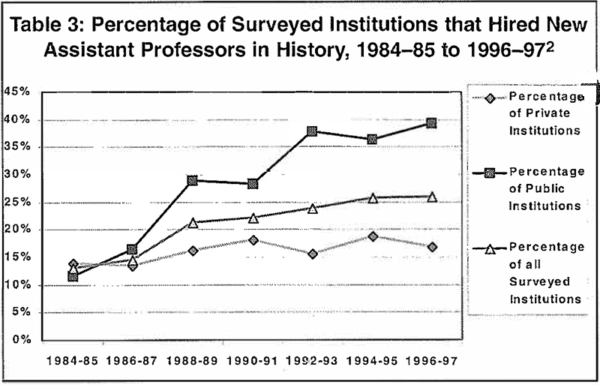
Table 3
The CUPA data also supports statistics from the AHA, published last March and April in Perspectives, which suggests an increase in the hiring of new faculty to replace tenured faculty.3 The CUPA reports provide information on the number of faculty in a discipline at each rank. Two years ago the author noted that the large percentage of full professors in history faculties at public colleges and universities (48.1 percent) made the survey’s fourth most top-heavy discipline. However, that number fell to 45.7 percent this past year—still well above the average of 36.7 percent for all disciplines, but declining notably.
At the same time, 26 percent of the institutions in the survey reported the hiring of one or more new assistant professors in the past year. The CUPA surveys have tracked a significant increase in the proportion of history programs hiring faculty at the assistant professor level over the past ten years. Notably, the growth in hiring occurred almost exclusively in history departments at public colleges and universities (Table 3). This will not solve the imbalance between the production of new academic history jobs and the annual production of history Ph.D.’s, however. At the 753 reporting institutions in the CUPA surveys, only 262 new assistant professors in history were hired for the fall of 1996. By comparison, according to the AHA’s 1996-97 Directory of History Departments and Organizations, 767 new history Ph.D.’s were conferred in the previous academic year.
Notes
- For more information, consult CUPA’s 1996-97 National Faculty Salary Survey by Discipline and Rank in Private Colleges and Universities and its National Faculty Salary Survey by Discipline and Rank in Public Colleges and Universities (1997). Also see “Not So Good: The Annual Report on the Economic Status of the Profession, 1996-97” in the March-April issue of the AAUP magazine, Academe. Special studies and tabulations can be obtained through the CUPA and the AAUP. Contact the AAUP at 1012 14th St., N.W., Ste. 500, Washington, D.C. 20005, (202) 737-5900, and CUPA at 1233 20th St., N.W., Ste. 31 Washington, D.C. 20036, (202) 429-0311. [↩]
- CUPA, National Faculty Salary Survey by Discipline and Rank in Private Colleges and Universities (published annually for the academic years 1986-87 through 1996-97), and CUPA, National Faculty Salary Survey by Discipline and Rank Public Colleges and Universities (published annually for the academic years 1986-87 through 1996-97). Salary figures are based on a nine- or ten-month academic year, full-time faculty only. Fringe benefits and summer earnings are excluded. [↩]
- See Robert B. Townsend, “Studies Report Mixed News for History Job Seekers,” Perspectives (March 1997, 7-10) and “Job Report 1997,” Perspectives (April 1997, 7-10). [↩]

