Although one of the latest studies on academic job production indicates continued improvement in the production of new history jobs, other studies on Ph.D. production and the competition for job openings warn of difficult times for new history Ph.D.’s.
A recent study by the Modern Languages Association (MLA), assessing job openings in a variety of disciplines, offers comparatively good news for history job seekers: history is the only discipline surveyed to enjoy three consecutive years of job growth.
Unfortunately, the latest study on Ph.D. production by the National Research Council (NRC) reports that history Ph.D.’s rose by another 11 percent in 1995. Another survey by the American Historical Association highlights the stiff competition for every advertised job opening in the field of history. An examination of the job market for specific subfields highlights the disparity between Ph.D. production and new jobs.
The MLA Study: Good News
The MLA report, prepared by MLA Director of Research Bettina Huber, provides up-to-date information on job openings in the fields of English, foreign languages, art and art history, history, political science, and sociology. A professional association for each discipline supplied the data, with data for history derived from job listings in the fall issues of Perspectives.
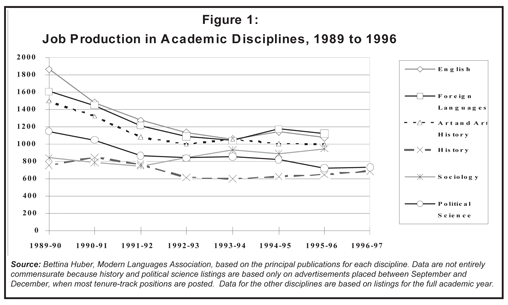
Figure 1
The data for job listings up to January 1997 show that history has recovered steadily from a job recession in the early 1990s that affected all disciplines (Figure 1). Job listings in the September to December 1996 issues of Perspectives were up almost 7 percent from the number of listings in 1995. This followed two years of growth near 4.5 percent. According to the MLA study, not one of the other disciplines has enjoyed more than two years of sustained growth in job openings since 1989.
In addition, history did not fall as sharply as the other disciplines (except sociology) in the declines of the early 1990s. History listings fell 24 percent from their peak in 1990–91, whereas openings for foreign modern languages fell 50 percent from their high point in the 1988–89 academic year. Listings for political science have fallen fairly steadily throughout the period of the study.
The number of history jobs appears smaller than in the other fields because the AHA has long counted only the listings between September and December, when most tenure-track openings are offered. The American Political Science Association also counts only the fall listings. The openings listed for the other disciplines, however, are counted for the entire academic year, which is why only history and political science include information for the current academic year.
1995 NRC Survey of Ph.D.’s: Another Sharp Increase
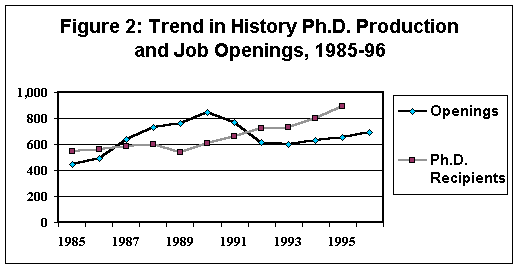
Figure 2
When the focus narrows to the supply and demand for academic history jobs, the news is quite troubling (Figure 2). The NRC reports that history Ph.D. production rose another 11 percent in 1995, the highest level since 1977.1 The 889 new history Ph.D.’s mark a 40 percent increase over Ph.D. production of just 10 years ago.
Among the 1995 Ph.D.’s, the proportion of women rose to the second highest level on record, with 332 female Ph.D.’s making up 37.3 percent of the total Ph.D.’s awarded. At the same time, the percentage of minorities receiving history Ph.D.’s rose to its highest level ever, reaching 11 percent in 1995.
History Ph.D. recipients in 1995 spent more time working toward the degree than almost any other cohort of Ph.D.’s. The average history Ph.D. received his or her degree 12.1 years after completing the baccalaureate degree, which included an average of 8.8 years registered as students in graduate programs. This helps explain why history Ph.D.’s are among the oldest at the time of degree among the disciplines, averaging 35.5 years of age. It is also notable that the registered time to receipt of degree was the longest of any field in 1995.
The prolonged effort to complete the degree, and the debts accumulated in doing so can only add to the sense of difficulty in the job market. More than 55 percent of humanities Ph.D.’s (history is not broken out as a separate category in the NRC survey) completed their degrees with some accumulated debt. Ph.D. recipients in the social sciences had a larger proportion of recipients leaving the academy in debt.
The sharp increase in new history Ph.D.’s places additional pressure on the already tight supply side of the job market. This was reflected in the lowest reported level of employment at the time of degree since the NRC began collecting data in 1970. Only 46.9 percent of history Ph.D. recipients reported “definite” employment plans when they received their degree; however, only 33.4 percent (down from 35.4 percent) reported that they were still “seeking employment.” The difference was based in part on an increase in the number of history Ph.D. recipients pursuing postdoctoral studies (now 11.1 percent) instead of immediate employment.
AHA Study: Strong Competition for Openings
A survey by the American Historical Association offers additional evidence that despite growth in the overall number of listings, the larger number of new Ph.D.’s coming on the market has produced stiff competition for each job opening. The AHA sent a questionnaire to search committee chairs for 442 tenure-track openings listed in Perspectives in fall 1995 and received responses for 267 openings (60 percent). The survey requested information about how many applications were received for the position. When a hire was made, the survey requested demographics on the individual hired and the reasons for selecting the candidate hired. When a hire was not made, the survey asked the reason for deferring the decision.
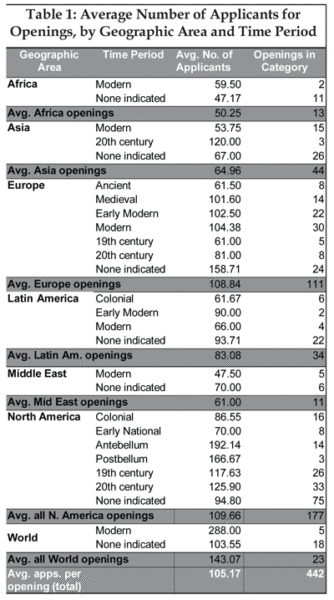
Table 1
The most striking finding in the survey was the large number of applicants for each opening (Table 1). There was an average of 105 applications for each position, with significant variations depending on the subfield. When compared by geographic area, world history openings had the highest number of applicants, with an average of 143 applications for each job listed. But this is not surprising given the breadth of the potential applicant pool. More surprising is the level of competition for European history positions, which averaged more than 111 applicants per opening. This was closely followed by North American history openings, which averaged 109 applications.
This does not mean that the competition is commensurately better for the other areas, however, because many of the geographic fields with fewer applicants offered fewer jobs. For example, Latin American history openings averaged 82 applications but offered only 34 tenure-track jobs in 1995–96. And although there were just 64 applications on average for Asian history positions, there were only 44 positions available.
Moreover, when the data are further refined to include chronological periods, the situation for North American job applicants looks more difficult. For instance, there was an average of 192 applications for jobs in antebellum U.S. history and only 14 jobs available. The average number of applicants is skewed downward by the large number of departments seeking applicants skilled in a thematic subfield of U.S. history rather than a particular chronological focus (listed as “none indicated” in Table 1). Within that category, there were 22 openings for historians with a general specialization in African American history, which received an average of 52 applications, and 6 openings for candidates specializing in women’s history, which received an average of 72 applications. Similarly, applications for European history openings indicate considerably wider disparities as the categories become more refined.
A number of job seekers have complained to AHA staff about working through the process of applications and interviews only to have the position canceled for budgetary reasons. Indeed, 15 percent of the positions advertised in Perspectives went unfilled. Cancellation of the job line by colleges or universities, however, was responsible for only one-third of the unfilled jobs (6 percent of the total jobs listed). An almost equal number of positions went unfilled because the search committee was dissatisfied with the applicant pool. In a quarter of the jobs that went unfilled, the job offer was declined by the final candidate. More than half of the departments that did not make a hire indicated that they have readvertised the position or will do so within the next two years.
Tracking Job Openings since 1991
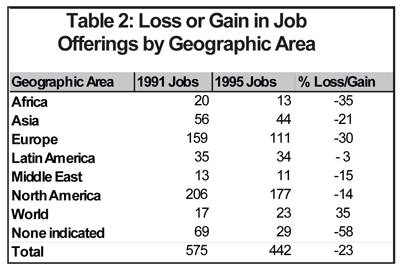
Table 2
The Association has been categorizing job openings since the high point of the academic job market in 1991–92.2 A track of the pattern of openings by geographic area points to another problem for those studying European history. The total number of job listings fell 23 percent in the five years that the AHA has been collecting data, but the number of new European history jobs fell 30 percent (Table 2). Openings in North American history fell 14 percent and positions in Latin American history fell 3 percent, whereas world history openings rose 35 percent.
An assessment of where the jobs are being created also points to significant regional shifts in job production (Table 3). Job openings fell in every region of the country except the Southeast, where job openings rose 12 percent. The Southwest suffered the largest drop in job openings at 41 percent, followed closely by the West (down 31 percent), the Northeast (down 25 percent), and the Midwest (down 23 percent). Given the disproportionate number of jobs in the Northeast, however, the drop in jobs there accounted for a third of the decline in job openings.
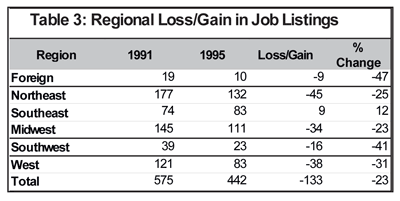
Table 3
This regional disparity in job creation accentuates the perception of a job crisis, because apparently fewer applicants seek employment in the Southeast. According to the survey of search committee chairs, job openings in the Southeast will receive almost 20 percent fewer applications than similar offerings in the Northeast. This is particularly true for positions in U.S., African, and Asian history, where the average number of applications to openings in the Southeast was almost half that in the Northeast. For instance, U.S. history openings in the Northeast received an average of 156 applications per opening, whereas new U.S. history positions in the Southeast received an average of only 84 applications per position.
Taken together, the MLA, NRC, and AHA surveys highlight larger concerns about the production of jobs and Ph.D.’s in the future. The survey of advertisers was part of a much wider data-gathering effort by the Association in fall 1996, which aimed to assess the current state and the future of the academic job market. In next month’s Perspectives, articles in this series will provide data from three additional surveys: a survey of department chairs about their estimate of where the market is headed, data from the Directory of History Departments on the demographics of current employment in the academy, and a survey of the chairs of Ph.D. departments about the supply side of the job market.
Notes
- P. H. Henderson, et. al., Summary Report 1995: Doctoral Recipients from United States Universities (1996). [↩]
- Susan Socolow (Emory Univ.), “Analyzing Trends in the History Job Market,” Perspectives, May/June 1993. [↩]

