The number of new history PhDs rose 3.1 percent—from 940 in 2006–07 to 969 in 2007–08. The increase was due in part to a growing number of women and minority students receiving degrees, as their representation reached unprecedented levels.
The growth in new history PhDs was double the increase among all disciplines over the same span, where the number of new PhDs increased 1.4 percent. Despite the increase over the average for all fields, history only accounts for 2 percent of the PhDs conferred last year, modestly below its representation over the past decade, which averaged 2.3 percent.
The information in this study was gathered by the National Science Foundation for a variety of federal agencies.1 Some of the demographic information has been on hold for the past two years due to privacy concerns among some smaller fields. As a result, some of this analysis will cover two years of data, for the academic years 2006–07 and 2007–08.
Historic Levels of Diversity

Figure 1
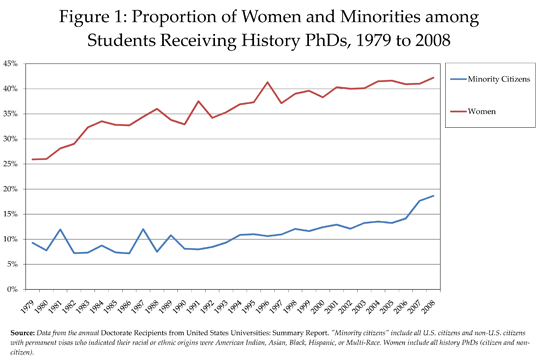
Demographically, the new 2007–08 cohort of history PhDs was the most diverse on record (Figure 1). Women comprised 42.2 percent of the new cohort of PhDs, up from 41 percent the year before. Although the change was relatively modest, this was the largest representation
On the other hand, this historic high for women PhDs in the history field does not seem quite so significant when compared to new women PhDs in all fields—46.1 percent—and even less so when compared with the proportion of women among new humanities PhDs—52.2 percent.
The proportion of racial and ethnic minorities among the new history degree recipients increased sharply in the two new years of available data—growing from 14.1 percent of the new PhDs in 2005–06 to 18.6 percent of the new history doctorates in 2007–08. A significant amount of the change comes from the inclusion of a “Multi-race” category, which accounted for 2.5 percent of the new history PhDs.
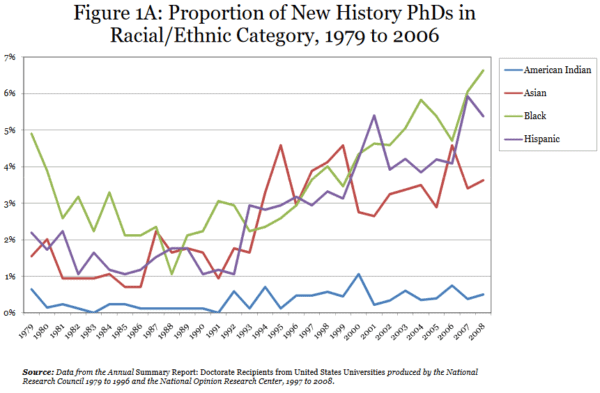
Among the new cohort, African Americans comprised 6.6 percent, Asian Americans 3.6 percent, Hispanics 5.4 percent, and Native Americans 0.5 percent of the new doctorate recipients in the field (Figure 1A).

Figure 1A
There are wide variations in representation of minorities among the particular field specializations in history, ranging from as high as 50 percent of the new doctorate recipients in Latin American history to as low as 5 percent of the new PhD recipients in the history of the Middle East. Among the American history doctorates, 17.7 percent of the new degree recipients identified as a member of a racial or ethnic minority, as compared to 10.4 percent of the
The differences among the fields are at least partially driven by identification with particular fields. Thirty-six percent of the degree recipients in Latin American history were Hispanic, for instance, and 35.9 percent of the new Asian history recipients were Asian Americans.
Other Characteristics of the New Cohort
The new PhD cohort spent 9.4 years in graduate study in history—slightly above the average of 9 years among all humanities disciplines, and well above the average of 7.7 years among all fields. Note that this average includes all graduate level studies, not just the time spent in the doctoral studies. This has been essentially unchanged over the past decade.
One of the other useful points of information is the amount of debt accumulated in the course of studies. While the report does not specifically report on history, the new cohort of humanities PhDs reported an average of $17,107 in debt as a result of their graduate studies—a useful reminder that the costs of study are measured in more than just time.
Among all humanities disciplines, 90.4 percent of the new degree recipients either planned or had employment in colleges or universities. In contrast, just 83 percent of the new cohort of history PhDs planned to seek employment in academia. Given the wider range of opportunities for historians in the wider job market outside academia, the discipline has long had a much lower number than average seeking employment in higher education.
Even though, as we note in the jobs report, the balance between advertised positions and PhDs looked fairly good over the past few years, the report indicates that the proportion of new PhDs reporting employment when they earned the degree has fallen substantially in recent years. Just 47.5 percent of the new PhDs had definite employment in 2008, which was down significantly from the recent high of 56.7 percent in 2005.
This variation can be due to changes in hiring patterns—in some employment cycles search committees prefer to hire students who already hold the degree. But it is deeply worrisome that the trend started even before the recent reduction in job openings.
Trends in Field Specializations
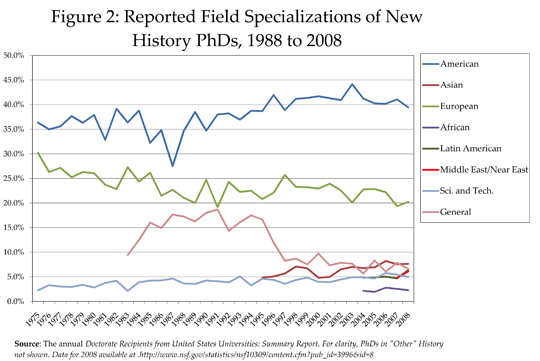
The study found relatively little change in the trends among the different subfields of history (see Figure 2). The study has (finally) added the field of Middle East and Near Eastern studies under history for the first time, and thus provides useful data about a significant and growing field in the discipline. Middle and Near East specialists comprised 6.1 percent of the new PhD recipients in history.

Figure 2
American history continues to dominate the number of new PhDs conferred, but the proportion of American history specialists receiving degrees fell below 40 percent for the first time in a decade. Only 39.4 percent of the history doctorates were in American history, as the real number of new American history PhDs conferred fell from 386 to 382.
The proportion of European history specialists increased slightly, from 19.4 percent of the new PhD cohort to 20.2 percent. In real terms, their numbers increased from 182 to 196 new doctorates conferred.
The largest growth was in the field of Latin American history, which increased by 40 percent, from 44 degrees in academic year 2006–07 to 62. Doctorates in the field jumped to 6.7 percent of all history degrees.
African and Asian history remained essentially unchanged from the year before, accounting for 7.6 and 2.3 percent of the new history PhDs respectively.
Notes
- 1. National Science Foundation, Division of Science Resources Statistics. 2009, Doctorate Recipients from U.S. Universities: Summary Report 2007–08. Special Report NSF 10-309. Arlington, VA. [↩]

