The number of job openings in history plummeted last year, even as the number of new history PhDs soared. As a result, it appears the discipline is entering one of the most difficult academic job markets for historians in more than 15 years.
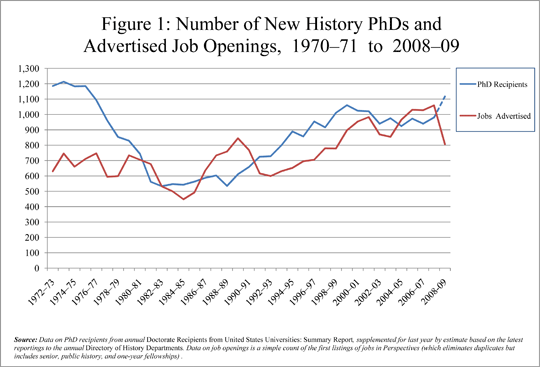
During 2008–09 job advertisements fell by 23.8 percent—from a record high of 1,053 openings in 2007–08 to 806 openings in the past year. This was the smallest number of positions advertised with the AHA in a decade (Figure 1).1 To make matters worse, a subsequent survey of advertisers indicates that about 15 percent of the openings were cancelled after the positions were advertised.

Figure 1
Even as the number of openings fell sharply, the number of new PhDs reported to the annual Directory of History Departments, Historical Organizations, and Historians increased by more than 17 percent, from 741 in the 2007–08 academic year to 869. This was the largest year-to-year increase since we began tabulating this information in the Directory in 1975. More than half the listing departments reported an increase in the number of PhDs conferred, as compared to less than a third reporting a decline.
It is worth noting that the number of history PhDs that will be reported in a year or two by the federal government (in its annual survey of earned doctorates) is likely to be significantly larger than 869. The government data includes students from departments in related fields, such as American Studies, who can select history as their field of study. As a result, the federal report more accurately reflects the real number of students entering the history job market each year. Our experience indicates that the Directory data provides a good estimate of the final figures. So if we follow past practice and extrapolate from the trend indicated by the Directory statistics, we can safely assume that about 1,100 new PhDs entered the history job market in the past year.
Taken together, these diverging trends mark the largest gap between new jobs and new PhDs since the job crisis of the mid-1990s. This situation is unlikely to improve in the current year, as job ads have continued to decline and the number of students in PhD programs remains relatively high.
Trends in Job Advertisements
Some interesting trends in hiring patterns are revealed when we differentiate the general decline in the number of openings into the particular subject specialties. Openings for historians working on the United States, for instance, fell by 30.3 percent, while openings for specialists in the history the Middle East and the Islamic World fell by a slightly larger 34.5 percent.
Most of the other broad fields suffered declines of around 20 percent, including world and transnational history (down 20.9 percent), European history (down 19.7 percent), and Latin American history (off 18.8 percent). Only two fields saw declines of less than five percent—African history (down 4.4 percent) and Asian history (off 3.1 percent).
Although it will be small comfort to new PhDs, the decline in the number of positions open to junior faculty was slightly less drastic, as the number of openings for faculty at the instructor or assistant professor level fell by a relatively smaller 20 percent—from 808 to 650 positions.
In terms of field specializations, the trends among the openings for junior faculty differed only modestly from the general developments indicated by the ads. Openings for specialists in Asian, European, Latin American, and world history, for instance, fell faster than the corresponding declines among all positions advertised. For instance, entry-level openings for Asian history specialists fell 7.7 percent—twice as fast as their decline among all open Asian history positions.
Openings for junior European historians fell 23.6 percent, for Latin Americanists 23.4 percent, and for world historians, 31.7 percent. In comparison, the number of openings for early career historians in U.S. history fell 22.9 percent.
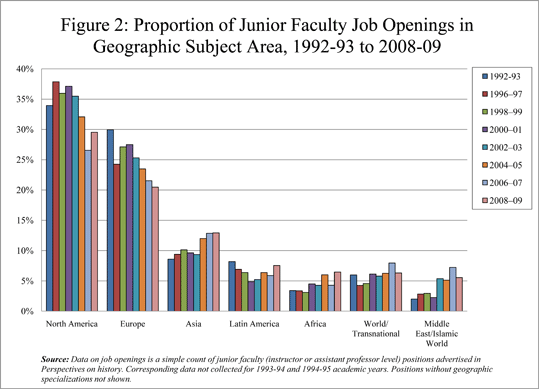
The long-term trends among the geographic fields suggests more troubling news for the discipline—at least in relationship to the trends among new PhDs. Over the past 10 years, the proportion of new PhDs identifying themselves as U.S. history specialists has hovered around 40 percent (see article on recent trends). However, the proportion of junior faculty openings targeted to specialists in U.S. history has declined gradually over the past 18 years—from slightly over 35 percent in the 1990s, to just below 30 percent this past year (Figure 2).

Figure 2
Likewise, jobs advertised in European history have declined from around 27 percent of the openings in the 1990s, to just a little above 20 percent this past year. The proportion of new PhDs in European history has been fairly steady through the same period, averaging slightly more than 21 percent of the new PhDs conferred from 2004 to 2008 (the most recent year for which we have data).
The proportion of new PhDs in other fields has consistently lagged behind their representation in the jobs advertised for entry-level faculty. In the past five years, Asian history openings averaged 12 percent of the new jobs, as compared to 7.4 percent of the history PhDs conferred from 2004 to 2008. Similarly, Latin American history comprised 7.1 percent of the positions advertised and 5.2 percent of the PhDs, while African history accounted for 5.3 percent of the jobs and just 2.3 percent of the PhDs.
Indicators from the Job Advertisers
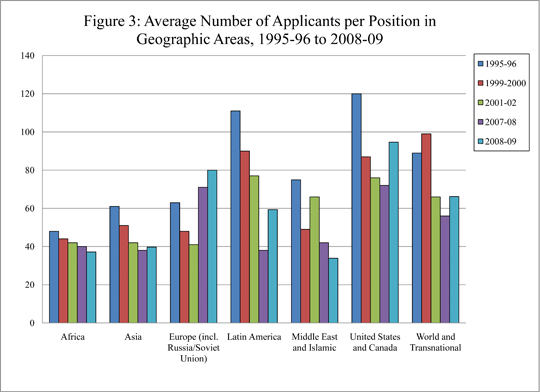
The divergence between jobs and PhDs in particular fields can be clearly seen in the average number of applications per job. Last year’s advertisers reported an average of almost 84 applications per position—up from an average of 57 applications per opening the year before.
The average number of applications had been falling steadily in the 14 years we conducted the survey, despite occasional fluctuations in particular fields. The latest figures show, however, an increase in the average number of applications to all positions. The current data also reveal what was also the largest number of applicants in more than a decade, surpassing the average in the 1999–2000 academic year (when advertisers reported an average of 79 applicants), though still well below the average reported in 1995–96 (102 applications).
Advertisers in most geographic fields reported an increase in the number of applicants, with only African and Middle Eastern history searches reporting slight declines (Figure 3). The field showing the largest proportional increase was Latin American history, in which the average number of applications grew from 38 applications to 55. It should be noted, however, that this sudden and steep increase followed a sharp decline in the number of applicants the year before. With the exception of that previous year, the number of applicants in Latin American history still remained well below those shown in all previous surveys.

Figure 3
The fields that already had the largest numbers of applicants—European and U.S. history—saw significant increases. The number of applications for European history positions was already on the rise, and increased further in 2008–09, to an average of 80 applicants per opening.
In contrast, the average number of applications for U.S. history jobs had been declining until 2007–08, though the rate of that decline had slowed in recent years. But this past year marked the first real increase in the number of applications to U.S. history openings over the past 15 years, as the average applicant pool grew from 76 to 94 per position.
Unfortunately, the growing number of applications for each available job was not the only problem this past year, as an unusually large number of positions were cancelled after the job was advertised—and in many cases, even after applications had been received. Of the 338 advertisers that responded to the survey, 22 percent (representing 75 positions) reported that the search had not resulted in a hire by fall 2009. Of that number, 51 indicated that the budget line had been cancelled, 9 indicated that they were still trying to complete the hire, and the rest reported that they either could not find a worthy candidate or their choice(s) had taken another offer.
The differences in the average number of applicants in particular fields were also reflected in the satisfaction of the job advertisers and their success in completing the search. While close to 90 percent of the advertisers for U.S. and European history jobs expressed satisfaction with the applications received, less than 80 percent of the advertisers in the fields of African, Asian, and Latin American history expressed similar satisfaction with their pool of candidates. Openings in fields outside U.S. and European history were also less likely to have successfully resulted in a hire—either because negotiations were still ongoing or the candidate had accepted another position.
Looking Ahead: A Growing Student Population
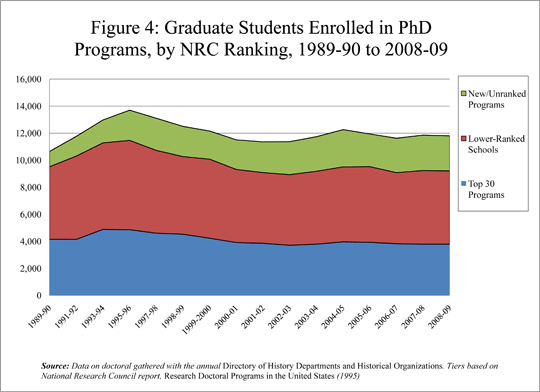
Even as the number of job advertisements seems likely to be depressed for the foreseeable future, the number of new PhDs in the pipeline remains quite elevated. The number (as listed in the AHA Directory)of graduate students in history departments that confer the PhD degree has been fairly steady over the past five years, at a bit fewer than 12,000 students in all.
All these graduate students are not in the doctoral program (since many of these departments also confer terminal MAs), but this number has proved to be a good barometer of student trends in these programs. After declining from their unsustainable heights during the job crisis of the 1990s, the numbers of students in doctoral programs have been relatively consistent over the past decade, across a number of variable types. For instance, programs in all levels of the National Research Council rankings have maintained around the same numbers of students in their programs over the past five years (Figure 4).

Figure 4
Our annual surveys of doctoral programs indicate some of the conflicting pressures on these programs. While an obvious long-term solution to the job crisis would be to cut the number of students in these programs, graduate programs have been a traditional refuge from hard economic times and this period appears no different. Over the past two years, the average number of applicants to history doctoral programs in the United States has increased rapidly—from an average of 80.9 per department for the academic year 2007–08, to 105.6 for the fall 2009 term.2
As a result, departments have been able to be more selective while also increasing the number of students admitted to the PhD program. For the current academic year, departments reported that they planned to matriculate an average of one more student than the year before—up from an average of 9.4 per department last year to 10.4 per department for the current term.
The growth in graduate student enrollment has been driven as much by the larger programs as the smaller ones. The largest programs (those that conferred an average of seven or more PhDs over the past five years) estimated that they would be adding an average of 20.2 new doctoral students this year; up from an average of 15.7 students a decade earlier. Medium-sized schools planned to admit an average of 6.8 students (up from 5.6), and smaller schools intended to add an average of 5.6 new doctoral students (up from 3.3).
Finding Balance
While it is small comfort to candidates on the current job market, it is worth noting that the near perpetual sense of crisis in history employment over the past 20 years had very little to do with a diminishing number of jobs, or even the growing use of part-time and contingent faculty.
More than half of the full-time history faculty in U.S. colleges and universities have retired and been replaced over the past 20 years, while the number of full-time faculty employed in history has grown steadily.
Among the 604 departments that were listed in the Directory in 2000 as well as in 2009, the number of full-time history faculty (at the assistant, associate, or full professor level) grew by 7.6 percent—from 8,772 to 9,436 over the decade. Other federal surveys conducted over the past two decades have shown similar growth in the number of full-time jobs for historians in academia as a whole, at both two- and four-year colleges and universities.
This hiring has been buoyed by significant growth in the number of undergraduate students taking history classes. According to the most recent figures from the federal government, the number of new bachelor’s degrees in the discipline recently reached the highest point in 35 years.3
The use of part-time and adjunct faculty in the discipline undoubtedly siphoned off some potential full-time job lines for historians, but that does not appear to be the most important causative factor for the problems of the history job market. The primary problem today, as it was a decade ago, seems to lie on the supply side of the market—in the number of doctoral students being trained, and in the skills and expectations those students develop in the course of their training.
But this supply-side problem cannot be solved easily. Keeping in mind that the average student spends eight years finishing a history PhD, it will take quite a while to change the actual number of students receiving PhDs.
The annual number of new history PhDs conferred peaked in 2000, seven years after we had warned about the impending job crisis of the 1990s. And even after that experience, the annual number of new history PhDs has declined only slightly, leveling out at between 900 and 1,000 since 2002. The number of students entering and still remaining in PhD programs indicates that the number of new doctoral degrees will remain at these levels for the foreseeable future.
So the future remains very unclear, as the trend in job advertisements and our earlier report on the state of the economy and history departments indicates.4 With hiring freezes, and many colleges and universities apparently willing to address their own budget shortfalls by using fewer teachers in larger class sizes, there is little reason for optimism about a significant upsurge in the number of job advertisements any time soon. Already the job advertisements for this year are running about one third below where they were this time last year.
One real alternative now for many history PhDs seems to lie in employment outside of academia. As our recent study of public history professionals demonstrates, history PhDs employed outside of higher education are generally quite satisfied with their jobs and earning salaries comparable to, if not better than, the salaries in academia.5
Unfortunately, very few programs prepare their students for jobs outside of academia, placing most of their emphases and expectations on preparing their students for the relatively small—and at least for the present, diminishing—number of jobs at research universities. Until programs reduce the number of students in their programs and revise the culture of history doctoral training, the sense of crisis in the job market for history PhDs seems only likely to grow worse for the foreseeable future.
Directory Editor Liz Townsend and Staff Assistant Maddalena Marinari assisted with the data gathering for this report.
Notes
- For the purposes of this tabulation, we only count full-time positions and fellowships paying $30,000 or more per year. Note that the tabulation for 2007-08 is slightly lower than previously reported, as we discovered on further review that six positions included in last year’s count were not valid under this rubric. [↩]
- This data is based on a survey of departments distributed each year with the updates for the Directory of History Departments and Organizations. This past year we received information from 90 of the 159 PhD-granting history departments in the History Doctoral Programs database. [↩]
- For more on this trend, see Robert B. Townsend, “Feds Report Rising Undergraduates and Declining PhDs in History,” Perspectives on History (May 2009), 8–9. [↩]
- Robert B. Townsend, “History in These Hard Times: Departments Struggle in a Depressing Economy,” Perspectives on History (September 2009), 6–9. [↩]
- John Dichtl and Robert B. Townsend, “A Picture of Public History: Preliminary Results from the 2008 Survey of Public History Professionals,” Perspectives on History (September 2009), 24–26. [↩]

