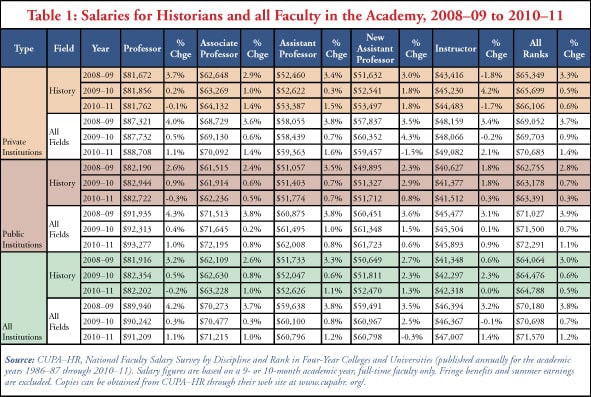
Average salaries for history faculty in four-year colleges and universities increased by just 0.5 percent over the academic year 2010–11—the smallest increase for our discipline in 25 years of surveying by the College and University Professional Association for Human Resources (CUPA-HR).1 Since the national inflation rate measured just under 2 percent over the same span (academic year 2010–11), the minuscule salary rise actually marked a real decline in the earning power of historians.
Historians in colleges and universities also lost ground in relation to faculty in the rest of academia. At public colleges and universities, the average salary for faculty members in all disciplines rose 1.1 percent, from $71,500 to $72,291, while the average for historians increased only 0.3 percent, from $63,178 to $63,391. The picture was only slightly better at private institutions, where the average salary for history faculty gained 0.6 percent, from $65,699 to $66,106. But here again, the increase in average salaries for faculty in all fields was more than double the growth in history, rising 1.4 percent, from $69,703 to $70,683. (See Table 1)

Table 1
The difference between public and private institutions is not surprising. A survey of history department chairs last fall found considerable pressure on departments to curtail costs, with the burden falling heaviest on departments and faculty at public colleges and universities.2 And these figures only count base salary levels, so they do not reflect further reductions in earnings at many public institutions due to state furloughs.
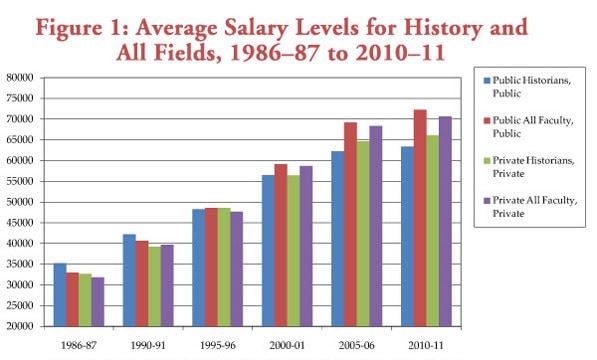
History’s decline relative to the rest of academia is part of a long-term pattern. It now seems a distant memory, but 15 years ago, history salaries were actually higher than the average for all disciplines (Figure 1). Since then, a surfeit of PhDs competing for history jobs undercut salary levels in our discipline. Another reason for the reduction in average salary levels for historians could be the general migration—in both methodological and administrative terms—of the discipline of history and historians from the social sciences to the lower-paid humanities at many institutions.

Figure 1
Today, salaries at all levels in the discipline are more closely aligned with the other humanities fields, particularly the languages and performing arts. As a result, history appears on the list of CUPA-HR’s disciplines with the lowest salaries for assistant and associate professors at public colleges and universities, and comes perilously close to being added to a similar list for private institutions.
After years of lagging behind in annual salary growth, average history salaries now fell almost 10 percent below the average for all fields—dropping 11.6 percent below the averages for all disciplines at public institutions, and 6.6 percent beneath the average salary at private colleges and universities.
Significant Differences among the Ranks
Despite the larger economic shifts in the discipline, the general financial pressures resulting from economic situation in the country, and a deeply troubled job market for the discipline, the survey indicates that faculty at the upper levels bore the brunt of the economic difficulties last year.
Average salaries for full professors in history actually declined slightly at both public and private colleges and universities. At private colleges and universities, the average salary for professors declined 0.1 percent, from $81,856 to $81,762. At public institutions, salaries at the top rank fell 0.3 percent, from $82,944 to $82,722.
Conversely, average salaries for new assistant professors rose faster than the average in the other disciplines—growing 1.8 percent at private institutions (from $52,541 to $53,497 for faculty members newly hired to that rank) and 0.8 percent at public colleges and universities (from $51,327 to $51,712).
Some of the difference in the salary levels is a result of changes in the overall composition of the departments. Judging from the reports of department chairs last fall, a number of factors pulled down salaries at the senior level. Some chairs reported that salary freezes at their institutions made it easier to get more money for a new hire than a bump in salary for a current faculty. A part of the decline in average salaries at the higher levels can also be attributed to some senior faculty members accepting a reduction in salary commensurate with a lessening of their teaching load as they begin the process of “phased” or early retirements.
A Different Perspective on the Job Market
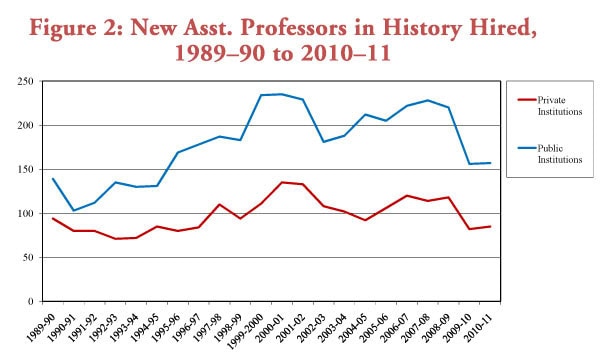
The report also shows that the troubles on the history job market persist, but suggests that they might not be quite as dire as the numbers drawn from the AHA’s job listings seemed to indicate.3 According to this report, the number of new assistant professors hired this past year was essentially unchanged from the year before (Figure 2).

Figure 2
The 697 institutions that report on history departments, added 242 new assistant professors to their faculty. This was up slightly from the 238 reported the year before, but still almost 30 percent below where it had been just three years earlier. The number of institutions hiring also increased slightly, from 168 to 179.
The difference between the jobs data in Perspectives on History and the hiring patterns shown in the CUPA-HR survey is at least partially attributable to the different composition in the ads posted with the AHA—which includes a significant number of senior, postdoctoral, and public history positions. This data suggests that the job market for junior faculty at four-year institutions might have reached bottom after the first year, and while it may not have improved, it is not getting any worse. But the evidence provides small comfort to candidates, as the substantial gap between new PhDs coming on to the market (over 1,000 in the 2008–09 academic year) and the number of junior faculty reported hired to these institutions over the past two years (less than 500) indicates a job market that is severely out of balance.
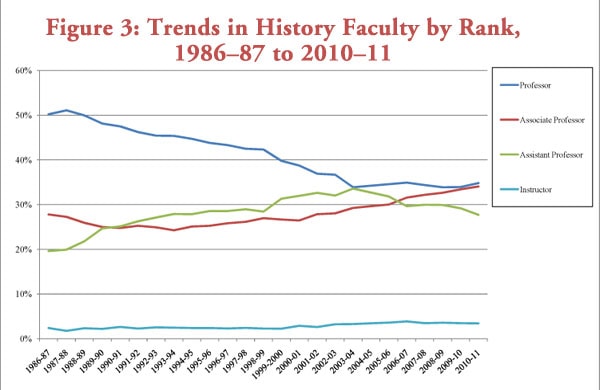
The decline in new hires and the phased retirement of some senior faculty had a significant effect on the overall profile of departments (Figure 3). The proportion of faculty at the top ranks (full and associate professors) now stands at its highest level in 13 years, at almost 70 percent of all full-time faculty in the departments.

Figure 3
Full professors now account for 34.8 percent of history department faculty at the responding colleges and universities—the highest level since the 2003–04 academic year, while associate professors now account for 34.0 percent of all history faculty (the highest level at least since the mid 1980s, when CUPA-HR started reporting this data).
Assistant professors now account for just 27 percent of all departmental faculty—the lowest level since 1994. This points to a significant generational shift that took place over the past decade, when senior faculty hired in the 1960s and early 1970s began to retire. Data from the AHA’s Directory of History Departments, Historical Organizations, and Historians shows that almost half (46.9 percent) of the full-time faculty listed in the Directory received their PhDs within the past 15 years.
Through the 1980s and 1990s, almost half of the history faculty had earned their PhDs between 1965 and 1975, which created a disproportionate number of faculty at the upper levels. As the unusually large proportion of faculty members now at the associate level indicates, departments are still in the process of rebalancing.
Unfortunately, the findings from CUPA-HR cannot answer a number of the more specific questions departments and faculty members often ask, such as the salary differences at particular types of programs or in different types of localities. The CUPA-HR data also excludes information on part-time faculty, which prevents us from seeing the totality of the faculty employed in history departments. But the report does offer a general benchmark for salaries in the discipline, and a target for improvement (in the average at each rank for all disciplines).
Notes
- CUPA-HR, National Faculty Salary Survey for the 2010–11 Academic Year, by Discipline and Rank in Four-year Colleges and Universities. (Washington, D.C.: CUPA-HR, 2011). The survey uses information reported by 812 institutions of higher education nationwide, which provided information on 214,155 faculty members. [↩]
- Robert B. Townsend, “History under the Hammer: Department Chairs Report Effects of Economic Woes,” Perspectives on History (January 2011). [↩]
- Robert B. Townsend, “Job Market Sagged Further in 2009–10,” Perspectives on History (January 2011). [↩]

