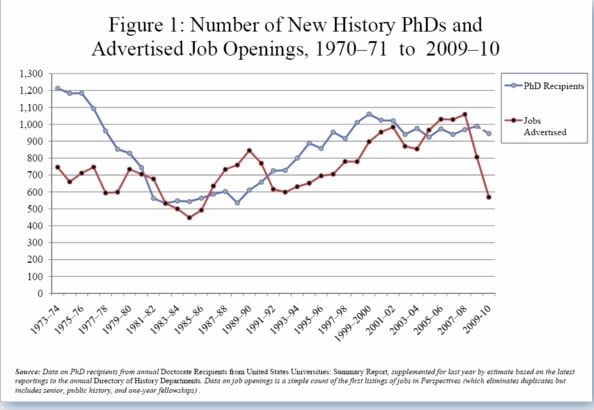
The number of jobs posted with the American Historical Association fell 29.4 percent during the academic year 2009–10, from 806 to just 569 openings, the lowest point in 25 years (since the 492 positions posted in 1984–85). This marks a precipitous fall from the historical high of 1,059 advertised positions recorded just two years ago.1
As the number of openings was falling, the number of new PhDs entering the job market (as reported by the federal Survey of Earned Doctorates in 2009), rose to the highest level in nine years—increasing from 969 to 989.2 Based on the number of new PhDs reported to the Directory of History Departments, Historical Organizations, and Historians this past summer, the number of new PhDs probably fell only slightly, creating a substantial gap between jobs and candidates on the market.

Figure 1
We can offer only one small piece of good news. As of December 1 of this year, the number of job advertisements had increased by 21.4 percent from the openings placed in the same period last year—rising from 421 to 511 positions.
According to dozens of department chairs contacted last fall, economic problems have led many institutions to freeze faculty hiring, which has prevented them from replacing faculty who retired or left the department for other reasons. This has forced departments to offer fewer courses, expand class sizes, and in a few cases to hire more contingent faculty on short-term contracts (see the report).
Fortunately, a small but significant number of departments reported that the hiring freezes at their institutions were thawing a bit, while others (primarily at private institutions), reported that they were actually increasing the size of their faculty to accommodate growing enrollment.
Declining at Different Levels in Fields
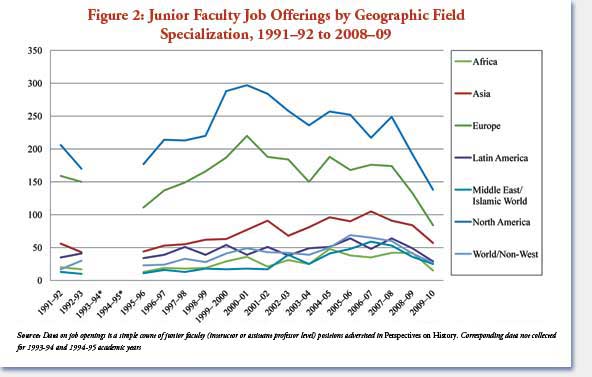
If we look more specifically at the openings for junior faculty (at the instructor and assistant professor levels), we can see wide variations in the job situation among different subject fields (Figure 2).

Figure 2
In relative terms, the field of African history saw the largest decline—falling 62 percent, from 42 openings in 2008–09 to just 16 this past academic year. Positions in the field of Latin American history also fell sharply, by 42.9 percent.
As in years past, the two largest fields for openings were in European and U.S. history, but they also experienced the largest real decline in jobs. Openings in European history fell 34.2 percent, from 155 to 102 positions for junior faculty. And openings in U.S. history fell by 28.1 percent, from 228 to 164 openings.
Even fields that have shown significant growth over the past decade saw a significant reduction. Openings for specialists in Middle East and Islamic history, for example, fell from 38 to 30 openings. This field and the more general field of world and transnational history, were the only geographic fields of specialization to still have advertised more openings than they did a decade ago.
The other notable trend is that the number of openings with no geographic specialization (asking only for a specialist in the history of religion, for instance) fell less than the geographic fields, declining by just 16.7 percent. And compared to a decade earlier, the number of advertisements in topical subjects had grown 20 percent.
A Decade of Growth despite Recent Cutbacks
Even though many departments have been suffering from attrition over the past two to three years, most of the departments that have listed in the AHA’s Directory of History Departments, Historical Organizations, and Historians over the past decade are still larger than they were five and ten years ago.
Of 573 departments that were listed in the 2000, 2005, and 2010 editions of the Directory, more than half (319) are larger today than they were a decade ago. In total, the number of full-time faculty at listed institutions had grown by 8.2 percent over the past 10 years.
Departments at private colleges and universities reported the larger proportional increase, as the ranks of full-time faculty in those institutions increased 10.1 percent from 2000 to 2010 (an increase of 295 historians for a current total of 2,935). Departments at public institutions added more faculty in real terms (430 in all), but since they have nearly twice as many full-time faculty (5,723) they only grew by 7.5 percent.
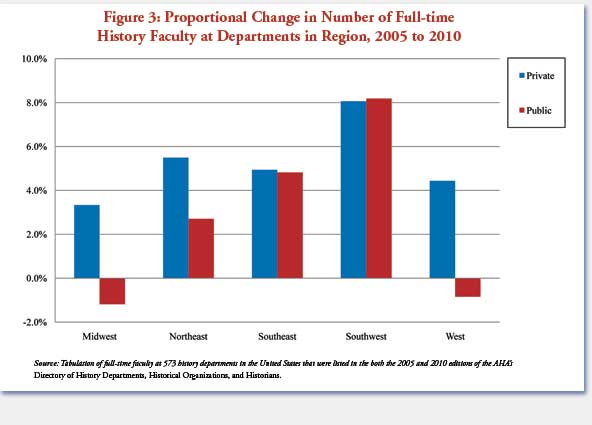
Looking more narrowly over the past five years, however, the varied effects of the recent cutbacks come more clearly into relief. Viewed as a whole, this group of history departments is still larger than they were, but there are significant differences between institutional types. Full-time faculty at public institutions are just 2.1 percent larger than in 2005, as compared to a 4.9 percent increase at private institutions.

Figure 3
And there are important regional variations as well. Programs at public colleges and universities in the Midwest and West experienced net declines in the number of full-time faculty (of 1.2 and 0.8 percent of their numbers respectively), while programs in the southeast and southwest had above average growth (Figure 3). The economic squeeze also appeared to affect programs at private institutions in the Midwest and west as well, where there was some growth, but it was also below the average for institutions in other regions.
Throughout the 2000s, history departments throughout the country benefited from sizeable increases in the number of undergraduate students taking courses and majoring in history, which helped leverage in new full-time and tenure track faculty. But many department chairs contacted in the fall worried that recent austerity measures, such as larger class sizes and more online teaching, will turn into permanent changes in the number of faculty lines.
Long-term Concerns
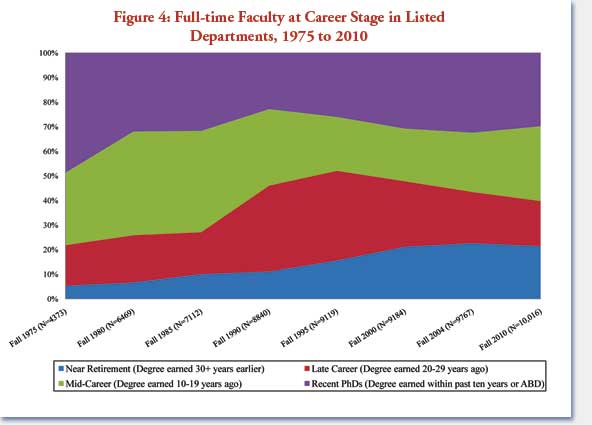
In addition to the chairs’ general concerns about what lies ahead for hiring in their departments, there are demographic reasons for viewing the coming decade with caution. First, the number of faculty approaching retirement age in the next 10 years is reaching the lowest level in 30 years. Currently, only 40 percent of the full-time faculty in history departments are 20 years or more from the time they earned their degrees (Figure 4).

Figure 4
From other sources, we know that the average faculty member earned her or his PhD at about age 34. Applying that figure to the faculty listings in the Directory, we can estimate that 21 percent of the current full-time faculty listed in the Directory are over the age of 64, and another 18 percent are over the age of 54.
This is the lowest proportion of faculty at this age level since 1985, when only 27 percent of the faculty in the discipline fit that profile. As Figure 1 indicates, this coincided with a nadir in available job openings. Faculty retirements were only one part of the equation back then—a general decline in history among general education requirements and a sharp decline in the number of history majors exacerbated the problem—but the lack of retirements further limited the number of available positions.
Since the mid-1980s, court rulings ended the mandatory retirement ages at many institutions, which led to a sharp increase in the number of faculty working well into and past their mid-60s. By 2000 the proportion of faculty in the late-career stages had grown to almost 50 percent. The subsequent retirements of the large number of historians who entered the discipline in the 1960s and early 1970s—together with a return of history to general education curriculum and a related increase in history majors—helped to sustain the surge in hiring through the past decade.
Given the current economic troubles for many departments, it is difficult to extrapolate a clear picture for the short term. But even if there were no hiring freezes to factor into the equation, it is clear that over the next 10 to 15 years the discipline will not be generating as many jobs from retiring faculty as it has in the recent past.
Doctoral programs should factor this trend into their admissions decisions for the near future. Data from PhD programs collected with the annual Directory show that the average number of applications to PhDs programs declined slightly in the 2009–10 academic year—from an average or 105.6 in the 2008-09 to an average of 90.5 this past year. And the anticipated number of students expected to matriculate into those departments also fell slightly, from 10.4 per program to 9.6.
But this remains above the number of students matriculating five and ten years ago. Those same departments estimated that they admitted an average of 8.2 students five years ago, and 7.2 students ten years ago. The programs reported that they had an average of 53 students in their program entering into the current academic year. This is down slightly from the average over the past five years, but the number is pulled down by a number of new doctoral programs, with smaller starting classes.
The largest programs (those conferring an average of more than seven PhDs per year) reported a modest increase in the number of doctoral students enrolled in their programs—rising to an average of 124 students per program as compared to 113 last year. These programs anticipated adding an average of 21.6 new students to their programs this year.
Most history doctoral students are being trained for an academic job market that is now beset by crises. Departments should begin to carefully reflect on the type of training they are providing their students and the number of students they are admitting to their programs.
Notes
- The jobs listed with the AHA may not include all the jobs available in the discipline, as some positions are advertised only in the Chronicle of Higher Education or H-Net, for instance. Nevertheless, the AHA job advertisements—the primary resource for history job seekers—serve as a useful and reliable barometer of the state of the job market in the discipline—both in its highs (such as two years ago), and the lows of the past two years. [↩]
- Mark K. Fiegener, “Numbers of Doctorates Awarded Continue to Grow in 2009; Indicators of Employment Outcomes Mixed,” InfoBrief (November 2010). [↩]

