The College and University Personnel Association has released its annual two-part report on faculty salaries by discipline and rank for the academic year 1984-85. In the discipline of history, the survey received information from 222 public institutions representing 2,310 faculty, and 342 private institutions with a total faculty of 1,615.
The table below lists average salaries for three academic ranks, “new assistant professor;” and an average for all ranks. The average salaries of four other disciplines embraced by the “social sciences” category and the average salaries for academic historians in 1983-84 are included for comparison. The most heartening news for the historical profession is surely the way salaries have kept pace with and even caught up to salaries in other disciplines (see, for comparison, Perspectives, May-June 1984, p. 4). Alas, the picture is not completely rosy: the salaries for new assistant professors increased by approximately 4.5 percent, while salaries for all other ranks increased from approximately 5 to 7 percent in history.
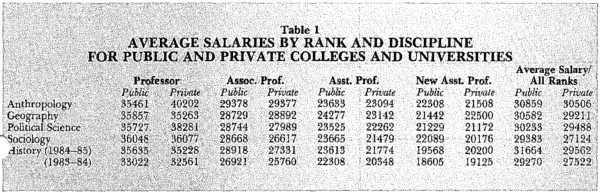
A further breakdown reveals that salaries in public institutions outpaced private institutions in every category but one, new assistant professor. Private institutions do demonstrate a more even distribution of faculty through the ranks than public schools, and proportionally have three times as many new assistant professors.
A new and very useful feature of this year’s survey is the inclusion of salary figures for public institutions with and without collective bargaining contracts. While most of the institutions surveyed do not have collective bargaining facilities, those that do offer higher salaries. In history, the difference is $3,833 on average per faculty member, although it should be pointed out that the difference is negligible for new assistant professors and curves upwards toward full professors. Collective bargaining information was collected from private institutions but not published, although it is available from CUPA.
As for the survey itself, while it has grown in size in recent years, some lacunae remain. Geographically, the Midwest and West (excluding California) are well represented overall (for the survey taken as a whole, 264 out of a possible 638 institutions granting baccalaureate degrees or higher, or 41 percent, and 48 out of 114 Western schools, or 42 percent).
However, neither California nor the East fared quite so well (259 out of 907, or 28 percent of all Eastern schools, and 37 out of 136, or 27 percent of all Californian institutions represented). The salary figures offered are most useful for comparisons between fields and disciplines, and are particularly valuable for comparing departments at similar schools. The only drawback with the CUPA survey as it stands is the fact that the relative narrowness of the sample obscures any national picture of salary trends that might be drawn. This is in part because the survey’s public sample is drawn from the membership of the American Association of State Colleges and Universities, which cosponsors the survey. By casting their net wider to catch the University of California and SUNY systems, as well as institutions both small and large that do not participate in the survey, CUPA and AASCU would strengthen an already valuable publication.
CUPA offers three “special studies” to institutions of higher education: group salary studies of ten or more “peer” institutions to compare salary levels between similar schools; salary trend studies by discipline, peer group, and/or complete survey sample for institutions that are participating in or have previously contributed to the CUPA survey; and a percentile ranking for participating institutions by discipline and/or rank comparing salaries with ten or more universities or colleges and estimating how much it would cost to move into a higher percentile. For more information, and for copies of the surveys, contact CUPA, 11 Dupont Circle, Suite 120, Washington, DC 20036.