The evidence is now clear: History departments are shrinking. While we lack recent data about the full range of possible career outcomes for history PhDs, recent estimates of the number of history faculty at two- and four-year institutions by the US Bureau of Labor Statistics (BLS) shows a decline of 16 percent from 2015 to 2024, and an analysis of full-time faculty listed in the AHA’s Directory of History Departments shows a decline of 13 percent from 2010 to 2025. While those trends reflect the accumulation of past hiring by history departments, looking ahead, the number of tenure-line jobs advertised with the AHA Career Center last year fell to the smallest number since the pandemic.
As many readers will know, the number of jobs listed in the AHA Career Center rose to the highest level on record in 2008, but then fell by almost 40 percent in the years after the Great Recession and has never recovered. Thanks to the protections of tenure, the decline in the number of full-time faculty in history departments has been far more gradual than the drop in job ads, but the data from the BLS and the Directory are now showing the effects.
The widest perspective on the state of the academic job market for historians comes from the BLS, which offers annual estimates of the total number of history postsecondary teachers at two- and four-year colleges. Unlike the Directory, it does not distinguish between full- and part-time faculty, so it provides a more holistic look at the total number of faculty employed to teach history. In its estimates, the number of history faculty rose from 16,560 in 2000 to a plateau of around 23,000 from 2010 to 2015. As of 2024 (the most recent available data at the time of this writing), that number is down to just 19,860 history faculty employed. Recent research by the Humanities Indicators confirms these trends, with department chairs in history (and other humanities subjects) expressing increasing pessimism about whether they could replace a tenure-line position if a faculty member left or retired.
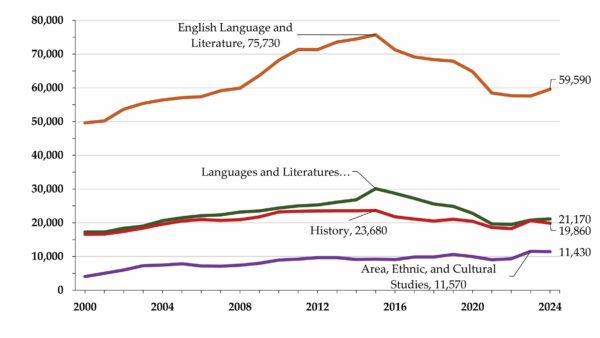
Fig. 1: Estimated number of postsecondary teachers in history and adjacent humanities disciplines, 2000–24. Source: US Department of Labor, BLS, Occupational Employment and Wage Statistics Program, Employment and Wage Estimates
As Figure 1 shows, the national trend for history is quite similar to the language disciplines, which saw a similar increase of about 18 percent from 2000 to 2015. While history employment figures fell 16 percent from 2015 to 2024, the number of faculty in English fell 21 percent, and the number employed to teach other languages fell 30 percent. Notably, the category of area, ethnic, and cultural studies is an exception, with gains from 4,070 faculty in 2000 to 11,430 in 2025. As many specialists in the field can attest, history PhDs often fill these positions, which serves as an important reminder that historians are not limited to jobs in history departments; however, there is no available data to show what proportion of those jobs have been filled with history PhDs. Similarly, there are a growing number of civics centers and civic education programs in the country that might also offer employment opportunities for history PhDs, though the best available estimates indicate that to date they account for less than 1,000 academic jobs.
The declines in history faculty varied substantially by region.
Beneath the national trends, the declines in history faculty varied substantially by region. In the Midwest, the number of history faculty fell 28 percent from 2015 to 2024, and in the Northeast, the number fell by 21 percent. To underline that finding, colleges and universities eliminated more than one out of every five history positions that existed in those regions in 2015. Regional differences appear to correspond with declines in history majors in those regions. From 2012 to 2024, the number of students earning history bachelor’s degrees in the Midwest fell 50 percent, while in the Northeast, the number fell by 44 percent. In every other region, the declines were less than 40 percent.
As the national trend indicates, the number of history faculty is down since 2015 but still higher than where it was in 2000, and that was true in every region except the Midwest. In the Southwest and West, the number of history faculty was more than 80 percent higher than it had been in 2000. Even in the Northeast, the number was still 23 percent higher. In the Midwest, however, the total number of history faculty was down by 20 percent from 2000.
The number of history faculty is still higher than where it was in 2000.
Since the BLS estimates include faculty employed to teach history regardless of tenure status and whether they are in a formal history department, it helps to compare those trends to the listings of full-time faculty in the Directory of History Departments, since they represent the most secure positions (even if some of them do not include the protections of tenure). Data on full-time faculty in 546 departments listed continuously in the Directory from 2000 to the present show more gradual movement both up and down, which is to be expected when looking at positions where tenure-line jobs are predominant. In the Directory, the number grew from 8,692 full-time faculty in 2000 to a high of 9,398 in 2010 (an increase of 8 percent), before falling to 8,210 faculty members in 2025 (down 13 percent from the high).
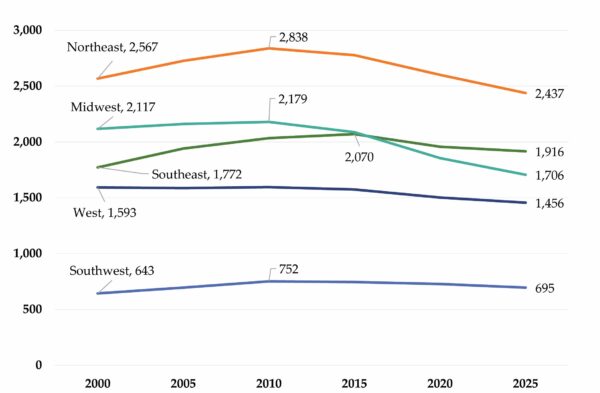
Fig. 2: Trend in full-time faculty at regularly listed history departments in the AHA Directory, by region, 2000–25. Source: Analysis of full-time faculty listed in 546 history departments in the United States listed continuously in the AHA Directory of History Departments (supplemented with counts of faculty listed on departmental websites to fill gaps)
As shown in Figure 2, declines occurred in every region of the country, but in line with BLS estimates, departments in the Midwest were the hardest hit, as they lost 22 percent of their full-time history faculty from 2010 to 2025. Departments in the Northeast were also hard hit, losing 14 percent of their full-time faculty positions. Even in the Southeast, the region with the smallest losses, the number fell by 6 percent. And very few departments were spared, with both very small departments (those with just one to four full-time faculty) and the very large departments (with 30 or more) each losing 13 percent of their full-time faculty from 2010 to 2025.
The Directory and BLS data provide important background context for an assessment of the recent trends in jobs advertised in the AHA Career Center. Since they represent the accumulated effects of past hiring, the job ads offer some perspective on the direction for the future. As Figure 3 shows, the 425 positions listed in the 2024–25 academic year represented a sharp decline from the recent average of around 500 positions per year (excluding the outlier year of the pandemic in 2020–21) and fell 16 percent below the number advertised the year before. This was the lowest level since the pandemic year, which was followed by a substantial rebound the following year but falling numbers every year since.
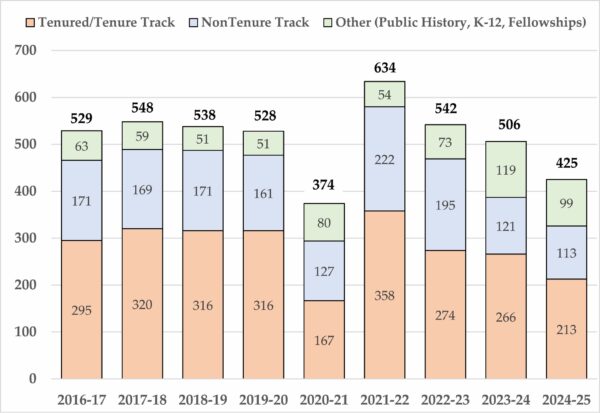
Fig. 3: Jobs listed in the AHA Career Center by category, 2016–17 to 2024–25.
Perhaps most troubling, the number of tenured/tenure-track positions advertised fell 20 percent from the prior year to just 213 positions. Non-tenure-track positions fell a more modest 7 percent. The other types of positions advertised, which included fellowships, K–12 teaching positions, and public history jobs, fell by 17 percent, but since most of these positions are advertised at the local level, they are much less representative of any trends.
Within the larger decline in job openings, there was a significant change in the mix of advertised positions. Notably, among the tenure-track positions listed in the 2024–25 academic year, the number of jobs seeking a specialist in the history of Europe was essentially unchanged from the number listed in 2021–22 (rising from 25 to 26; Table 1), while listings for specialists in the history of the United States and North America fell by 10 percent and jobs for every other category fell by more than 26 percent. As a result of those shifts, openings for positions focused specifically on US history rose from 22 percent of the tenure-track openings in 2021–22 to 39 percent of them. Openings for specialists in European history rose to 12 percent of the total. The largest decline occurred in the world/global history category, which fell from one in five positions in 2021–22 to less than half that share last year.
Table 1. Jobs listed in the AHA Career Center for tenure-track faculty by field of specialization, 2020–21 to 2024–25| Year | Africa | Asia | Europe | Latin America | Middle East/North Africa | Multiple Geographic Fields | Other/ Open/ Topical | United States/North America | World/Global |
|---|---|---|---|---|---|---|---|---|---|
| 2020–21 | 12 | 13 | 10 | 8 | 4 | 5 | 54 | 52 | 11 |
| 2021–22 | 27 | 36 | 25 | 11 | 11 | 14 | 113 | 93 | 87 |
| 2022–23 | 21 | 23 | 21 | 12 | 12 | 8 | 76 | 90 | 56 |
| 2023–24 | 14 | 30 | 28 | 18 | 10 | 9 | 41 | 91 | 25 |
| 2024–25 | 11 | 24 | 26 | 7 | 8 | 6 | 34 | 84 | 13 |
Among the openings for non-tenure-track positions, the specialization trends were similar, but among the positions without tenure, positions either in US history or without a specific geographic field specialization have predominated until recently. Over the past four years, there was a modest increase in the number of ads looking for a specialist in European history (up to 10 positions from seven) and a notable increase in the number of jobs open to more than one field of specialization (from five to 12). But the number of openings that had no specified geographic focus fell from 110 to just 26 openings last year. And the openings for US history specialists fell from 93 to 40.
Viewed collectively, the recent trends send troubling signals about the current direction of the academic job market. This is not the first time the field has had to deal with weakness in hiring by history departments. In the 1970s, a sharp drop in hiring took more than a decade to rebalance. Trends moving in one direction can always turn around (and often have in the past), but the current evidence underscores the need for anyone earning a history PhD to be prepared to look beyond the academic job market for future employment.
This work is licensed under a Creative Commons Attribution-NonCommercial-NoDerivatives 4.0 International License. Attribution must provide author name, article title, Perspectives on History, date of publication, and a link to this page. This license applies only to the article, not to text or images used here by permission.