The charts below are a new interactive online-only feature, and an experiment. We hope readers will explore the data, make discoveries, and share them with us (there is a comment section at the end of this article). Captions in the band allow navigation through the several slides. Filters appear on the side of each chart, and placing a cursor over data points will reveal additional information. Please be patient while we work out any bugs, and please send any comments to amikaelian@historians.org.
Colleges and universities in the United States awarded 37,752 bachelor’s degrees in history (including first and second majors) in academic year 2012-13, according to data from the National Center for Education Statistics (NCES). That’s 918 fewer than in 2011-12—a decline of 2.4 percent. The 2012-13 total is just below the total number of degrees awarded in 2006. History’s share of all bachelor’s degrees dropped as well (to 1.9 percent), continuing a seven-year slide.
These figures suggest either a discipline that is struggling to make its case to undergraduates or a discipline holding on in the face of rapid change in the college population and the institutions students attend. The challenges facing history can be seen in the multiyear decline in history bachelor’s degrees awarded by research universities, and a similar drop in institutions focused on arts and sciences. These two types of institutions have long been home to a solid and dependable core of history graduates. At the same time, a growing number of students are earning bachelor’s degrees at institutions that graduate no history majors.
A further challenge is visible in the fact that the discipline continues to graduate a disproportionate number of male students. In the latest data, women comprise 57 percent of all bachelor’s degrees, but only 41 percent of all history bachelor’s degrees. The latter figure has barely moved over the last 10 years.
Still, the history major is not in decline across the board. Many departments are adding majors and increasing their share of their institution’s bachelor’s degrees. As we drill down, patterns emerge that suggest the discipline continues to attract undergrads, and has the potential to attract more—but where these undergrads study may be undergoing a significant change.
One important shift, which may be the most difficult to address, is the fact that an increasing proportion of the total of all bachelor’s degrees, in all fields, are being awarded by institutions that do not graduate any history majors at all. In 2004, these institutions accounted for 9 percent of all bachelor’s degrees awarded. In 2013, they accounted for 13 percent. A high percentage of these institutions are for-profit. If we exclude these institutions when calculating history’s share of all bachelor’s degrees, history’s share increases very slightly, to 2.2 percent.
These institutions have never been a choice for students interested in studying history, but other groups of institutions that have long accounted for the bulk of history majors are graduating fewer of them. This magazine has previously reported on the decline in history bachelor’s degrees from universities with very high research activity. This decline accelerated in 2012-13, dropping 6 percent from the previous year, and a total of 10 percent since 2008. In 2012-13, this group of institutions awarded just slightly more history bachelor’s degrees than it did in 2004. This group of institutions accounted for 36 percent of all history bachelor’s degrees in 2004; it now accounts for 31 percent.
When we look at trends within broad types of undergraduate instructional programs, we find a similar shift. The Carnegie classification divides instructional programs along a spectrum: one side is defined by a high proportion of bachelor’s degrees awarded to majors in professional fields (like communications, business, or engineering); the other end of the spectrum awards a higher proportion of degrees to majors in arts and sciences fields (like psychology, classics, and physical sciences).
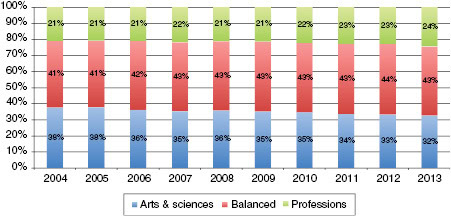
Balanced programs, which award close to the same number of professional degrees and arts and sciences degrees, continue to produce the greatest share of history graduates (41 percent in 2004 and 43 percent in 2013). However, the institutions that lean toward or focus heavily on arts and sciences have, over the past 10 years, gone from producing 38 percent of the history graduates to producing 32 percent (among bachelor’s degrees overall the shift was less than 2 percent, and the shift in the balanced programs went the other way). Both balanced programs and arts and sciences programs awarded fewer history degrees in 2012-13 than in 2011-12 (fig. 1).

Figure 1. History bachelor’s degrees by undergraduate instructional program
This figure shows the percentage of history bachelor’s degrees by broad instructional category. Professional-leaning institutions have increased their number of bachelor’s degrees in history, while institutions leaning toward arts and sciences have graduated fewer. Source: NCES. For this chart, institutions classified as “Arts and Science Focus” have been combined with “Arts and Sciences plus Professional,” and likewise with the professional-leaning programs. The one percent share of history bachelor’s degrees awarded by programs outside of this classification in 2013 is not shown here.
Still, even in this year of overall decline, we can find evidence that the history major is growing among certain groups and types of institutions. It’s just not where we might expect, if we associate the history degree primarily with research powerhouses on the one hand and arts and sciences programs on the other. Institutions that lean toward the professions (termed “professions plus arts and sciences,” with 60-70 percent of their undergraduate degrees in professional fields) have been steadily increasing their share of all history bachelor’s degrees, from 21 percent in 2004 to 24 percent in 2013 (the trend for all bachelor’s degrees is moving in the opposite direction). This is a small percentage shift, but these institutions, which accounted for nearly 8,700 history bachelor’s degrees in 2012-13, are now awarding more of these degrees than institutions that lean toward arts and sciences (termed “arts and sciences plus professions”). And the professional-leaning institutions increased their number of history graduates even in years when the overall number of history graduates fell (like this most recent year, for example).
Looking at tuition reveals another shift. Comparing 2012-13 to the previous academic year, we find that the total number of history graduates dropped at all levels of tuition except one; as a group, programs with in-state tuition of less than $5,000 defied the trend and awarded more history degrees. These inexpensive institutions are continuing an upward trend in which they have increased their number of history graduates by 34 percent over 10 years. Institutions with tuition above $35,000, as a group, graduated fewer history majors over the same period. Institutions in the $40,000-$45,000 range graduated 18 percent fewer.
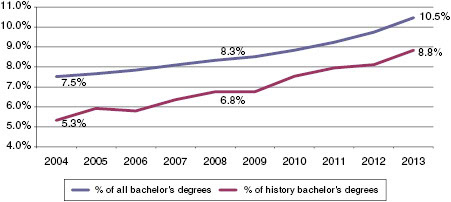
As has been discussed in previous issues of Perspectives, Latino students are steadily increasing their participation in the history major. In the latest data, the number of history bachelor’s degrees awarded to Latino students increased over the previous year, while awards to all other racial/ethnic groups, including whites, went down. This continues a multiyear and accelerating trend, one not seen in any other racial/ethnic breakdown. Even at the research universities, which have seen the largest decrease in history bachelor’s degrees overall, the number of Latino students continues to climb—in fact, Latino history majors’ share of history degrees from research universities is now greater than Latinos’ share of all bachelor’s degrees from those universities.

Figure 2. Proportion of Latino graduates
The top line shows the increasing number of Latino students earning bachelor’s degrees in all fields, as a percentage of all bachelor’s degrees. In 2013, 10 percent of bachelor’s degrees in all fields went to Latino students. At the same time, Latinos have increased their share of history bachelor’s degrees, and the gap between the two lines is narrowing. At research universities, these lines have crossed, with Latinos overrepresented among history graduates. Source: NCES.
Drill down as much as we like, we still will never get to the data point that really matters—the individual student’s decision to pursue a history major, or not. But we might indulge in some hopeful thinking about some of these trends.
The history major is not just for those drawn to schools that lean toward arts and sciences. Many students who have inviting professional programs available to them, even those who are in schools geared toward professional degrees, are still choosing the history major—in increasing numbers.
The history major is not just for the elite schools and high-paying students. It has appeal among those paying very low tuition as well. In fact, one might imagine that students who don’t have staggering tuition bills hanging over them might feel freer to choose a major not associated with a rigorously defined career path.
The history major is not just for white students. Even though the discipline struggles to recruit African American and Asian students, Latino students are demonstrating that the major potentially has wider appeal.
If we were to further indulge our hopeful thinking, we might speculate that these small shifts, visible underneath the larger totals, might be leading toward a broadening of the major, not a contraction. Or we might be motivated to use what we learn from these small shifts to bring that broadening about.
This work is licensed under a Creative Commons Attribution-NonCommercial-NoDerivatives 4.0 International License. Attribution must provide author name, article title, Perspectives on History, date of publication, and a link to this page. This license applies only to the article, not to text or images used here by permission.

