History is the second largest humanities field, behind English (and American) language and literature, and accounts for 23.9 percent of the doctorate population.
The National Research Council has released its 1983 Profile of doctorates in the United States. The Profile includes all disciplines—sciences as well as nonsciences—and analyzes the demographic and employment characteristics of 470,000 holders of doctorates. The report is useful both for its “snapshot” description of the professions, including history, and for its information on trends.
Population Levels: There are 85,200 humanities doctorates in the United States; 77,900 are in the labor force. The “humanities” include history, art history, music, speech/theatre, philosophy, English and American language literature, classical language/literature, modern language/literature, and “other” humanities. These figures are increases over 1981: there are 12.1 percent more doctorates and 11.8 percent more in the labor force. Some of this increase reflects a change in NRC procedure and classification of fields, and since the 1970s the growth rate has actually been falling off. Nevertheless, more humanities doctorates are entering the marketplace than are leaving due to emigration or death. History is the second largest humanities field, behind English (and American) language and literature, and accounts for 23.9 percent (20,400) of the doctorate population (1940-1982 graduates).
Mobility: “Field mobility” is considered a prime indicator of “the ability of PhD recipients to adapt to changing employment opportunities.” The mobility is measured in three ways: in field, in humanities (if not in field), and out of humanities. Almost every humanities field experienced a “loss” of a significant percentage of their doctoral population. The mobility rate of historians was one of the highest: 35.6 percent of history PhDs in 1983 working in jobs other than history. By contrast, only 6 percent of the science/engineering doctorates are working outside science.
ls the employment glass half full or half empty? That so many PhD historians could find jobs outside their field is evidence of great flexibility, and perhaps also of varied ambitions. It might also be evidence of a serious imbalance between supply and demand, or a malaise within the doctorate population itself. We do not know how many history PhDs voluntarily removed themselves from the history job market.
Demographic Characteristics: The doctorate history population is still predominantly white (91.9 percent) and male (83.4 percent). The humanities fields displaying greater variation in composition are art history and modern languages/literature. It is noteworthy that while the history doctorate population (with philosophy) is the most homogeneous, the humanities population at large can be characterized in much the same way. In fact the difference between history and the humanities population as a whole (all fields) are minimal.
The median age of PhD humanists is 45 years. Historians are slightly “older” than the total population, with a median age of 46 years. This age—or relative youth—is directly related to recent trends in PhD production. More than one-third of all humanities PhDs earned their degrees between 1975 and 1982.
Employment Status: Almost all humanities PhDs are in the labor force (91.4 percent); there is little difference in this rate from field to field.
There are several measures of utilization or underutilization. The most obvious is unemployment, where the rate for all fields in the humanities is 1.7 percent. This includes only those seeking employment. The percentage for history is 1.2. A more sensitive and revealing measure of underemployment is part-time employment.
The Profile report breaks part-time employment down into two categories, those seeking, and those not seeking, full-time employment. The part-time employment rate for all humanities PhDs is 7.3 percent with the majority working on a voluntary basis. History PhDs had the lowest percentage of part-time employees, 5.8 percent.
These figures actually mask rather serious discrepancies—and much higher percentages—when examined from the perspective of gender. By these measures women are far more at risk than men in being un- and underemployed. This held true for every field for which data was available. Women in history, a typical field, have an unemployed and seeking employment rate (3.5 percent) that is four times higher than for men (.8 percent). The variation in part-time employment (and seeking full-time) is greater still: 6.3 percent for women and 1.1 percent for men. And women are about half as likely (.8 percent) to hold postdoctoral appointments (the percentage for men is 1.4 percent).
A final category of utilization is non-humanities employment. This is also the most slippery. The sciences and engineering generate very few PhDs who leave the sciences. Almost 20 percent of humanities PhDs (the rate is higher in history), by contrast, have left the humanities. Whether these are voluntary departures, or departures born of frustration in finding secure humanities employment, cannot be determined. But given the expense—personal and financial—of earning an advanced degree, it is hard to see this pattern as anything but disturbing.
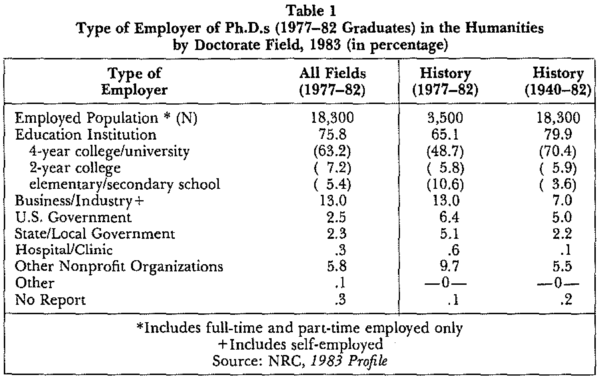
Type of Employer: Far and away the most important employers of humanities PhDs are educational institutions. Of the 75,500 employed PhDs, 82.9 percent work for colleges or schools. Interestingly, this percentage is down from 85.4 percent in 1981 and 88 percent in 1977. This trend is matched by higher employment rates in noneducation sectors.
Some of the most significant changes have occurred among history PhDs, especially recent degree recipients. While 79.9 percent of 1940-82 history PhDs worked in educational institutions, only 65.1 percent of 1977-82 graduates did the same. The most pronounced shift within educational institutional employment is in the category of schools: 3.6 percent of the 1940-82 history PhDs worked in elementary/secondary schools, compared to 10.6 percent of the 1977-82 graduates. This recent cohort is also more likely to take jobs in business and industry (13 percent vs. 7 percent), US government (6.4 percent vs. 5 percent), state and local government (5.1 percent vs. 2.2 percent), and nonprofit organizations (9.7 percent vs. 5 percent).
When compared to the humanities Ph.D.s in all fields, the historians are pacesetters. Looking at the 1977-82 PhD recipients, and comparing them with the same graduates of all fields, the breakdown is as indicated in Table 1.
Primary Work Activity: As a function of who employs PhD humanists (educational institutions predominantly), it is not surprising that the Profile reports 66.3 percent of all employed PhDs in all fields engaged in teaching. The second most common work activity is management and administration (11.4 percent).
Once again, history PhDs stand out. They are the least likely (61.6 percent) of all humanities fields to work as teachers. They are the most likely to work in management and administration (14.2 percent). More recent PhD recipients in history (1977-82 graduates) exhibit even stronger nontraditional patterns: only 54 percent went into teaching.
Once again we are confronted by a peculiarity of history PhDs. Of all the fields in the humanities, historians are the most venturesome, or at least the least likely to conform to the employment norms evident in the other fields. Keeping in mind that historians have one of the lowest unemployment levels, history PhDs are either being forced out of their fields to an uncommon degree, or are more adaptable and opportunistic than others, or both. A case can be made, in any event, that there is still a serious supply and demand problem in traditional occupations of his tory.
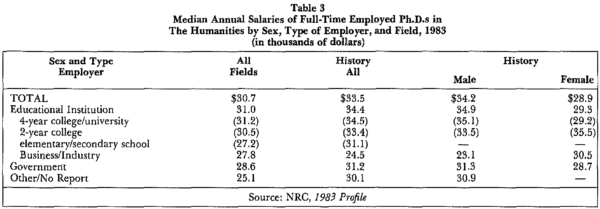
Salary: Salaries in the humanities have been rising steadily for the past several years in part as a catch up for the inflationary 1970s. For humanists employed full-time in 1983, the median annual salary was $30,700. This is 16.3 percent higher than the reported salary of 1981—but only a 5 percent increase in actual purchasing power when adjusted for the cost of living (11.4 percent since 1981). Salaries varied by type of employer. Employees of educational institutions earned higher salaries than all others ($31,000), and employees of four-year colleges and universities earned highest of all ($31,200). The reported salaries for business and industry were $27,800 and for government, $28,600.
Historians, according to the Profile, are among the highest paid in the humanities (with a median annual salary of $33,500). Only speech/theatre outranked history in earning power. There are some gender variations, largely (though not entirely) explained by years since receipt of a PhD. The variation no doubt would be much wider if the Profile included part-time employees in its calculation, a category which is disproportionately female, see Table 2.
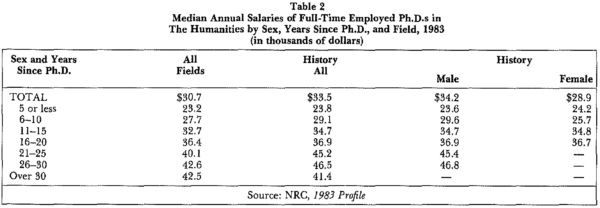
One of the most striking income figures appearing in the Profile concerns business and industry employment. This category includes the self-employed, and in every field for which there is data, women history PhDs consistently registered higher incomes than men history PhDs. Among women, those in business and industry also registered higher incomes than women in academe—a major reversal from the norm in the humanities population. In one other respect, women demonstrated an unusual income pattern. They earned exceptionally high incomes in two-year colleges-higher than women in four-year colleges and universities, and higher than men in four- and two year institutions (see Table 3).
Academic Employment: The academy still is the most important employer of PhD humanists; employment trends in the academy therefore have important implications for future hiring and promotion.
The percentage of faculty with full professor (42 percent) and associate professor (31.5 percent) status is up since 1977. There has been a decline since 1977 in the proportion of assistant professors. This is evidence of even larger numbers of faculty moving into tenured positions, 75 percent in 1983 (up 6.6 percent since 1977).
With an increase in tenure, the Profile also documents an increase in nontenure-track positions since 1977—a finding that has been echoed in every major study of academe employment trends. The picture for history is not, in outline, atypical. There are 14,100 history PhDs employed in the academy; 10,762, or 76 percent, have tenure. Almost one-in-four do not have tenure, and of this group 39.4 percent are in tenure-track positions while 46.6 percent occupy non-tenurable slots. There is no reported information on the remaining untenured 14 percent.
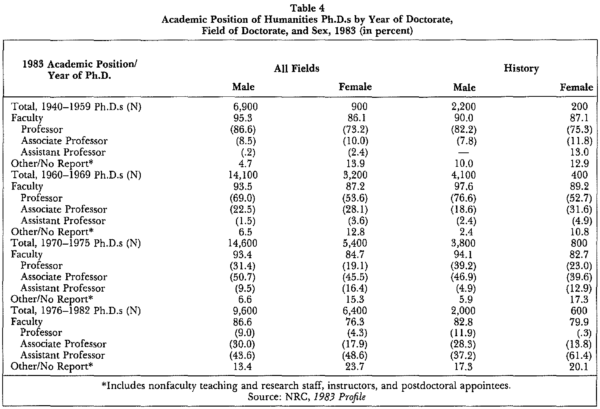
It is the area of faculty rank and tenure of all others examined in the Profile, that gender variations loom largest. And this is true for most fields. Men are far more likely to occupy full professorships, and somewhat more likely to occupy associate professorships. Women are disproportionately numerous in assistant professorships. It is important to note that these discrepancies surfaced with a control for date of receipt of PhD. Of all the fields, history seemed consistently to have the widest gaps in rank between men and women of the same cohort.
The Profile also includes data on tenure and nontenure status by field and by sex, but unfortunately uses age as the control rather than the more revealing date of degree. But a similar trend was evident: in every age group (age 35 and under, age 36-45, over age 45) men had a higher percentage of tenured faculty positions. More encouraging news is that 52.3 percent of women in the age 35 and under category hold tenure-track jobs. This holds promise that at least some of the gender imbalance in tenure and rank is in the process of correcting itself.
The 1983 Profile shows a profession in the throes of change. While unemployment and involuntary part-time employment rates are not high, a seemingly unprecedented percentage of historians hold nontenurable faculty positions. A large percentage of recent history PhD recipients, upwards of 46 percent of the 1977-82 graduates, were working in nonteaching jobs in 1983. Looked at another way, about 35 percent of history PhDs in the labor force are working in fields other than history. All of this seems to be adding up to more varied career paths for history doctorates. This need not be seen as a negative development. At the least it is evidence of a considerable flexibility among historians and, if salary is any measure, employment success. It also prompts continued and serious consideration about the balance between PhD supply and demand. Finally, the Profile contains valuable information on gender. The disadvantages of women in academic employment are still much in evidence, and regrettably so given the affirmative action guidelines many institutions have put into effect in recent years.
Copies of this report (Science, Engineering, and Humanities Doctorates in the United States, 1983 Profile) may be obtained by writing: National Research Council, Survey of Doctorate Recipients, Room JH634, 2101 Constitution Avenue, NW, Washington, DC 20418. Computation of data in the humanities is supported in part by a grant from the National Endowment for the Humanities.