Women and minorities remain only a small part of the history profession, despite decades of efforts to increase their relatively modest numbers. Whether one looks at recent snapshots or longer trends, by most measures, it appears the discipline’s glass ceiling remains largely intact.
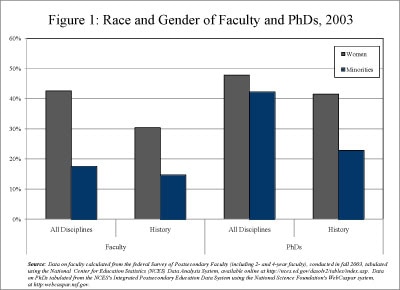
Figure 1
According to the most recent federal survey of faculty, 30.4 percent of the history faculty in American colleges and universities are women and 14.7 percent are minorities.1 In contrast, if one looks at faculty in all disciplines, women comprise 42.5 percent, while minorities account for 17.5 percent (Figure 1).
Recent data about history PhDs awarded appear to indicate more positive trends, as 42 percent of the new PhD recipients have been women while minorities have accounted for around 20 percent. But this evidence of gains among new PhDs is rather deceptive, as the long-term trends suggest that the shift toward greater demographic balance largely ended in the 1990s.
A survey the AHA conducted in 1980 found that women comprised just 14 percent of all history faculty. By 1992 women reached 25 percent. Even though the representation of women is now approaching 31 percent of the faculty, it appears the rate of growth has slowed. Over the past decade, the profession has been increasing the proportion of women in history at a rate of only about 2 to 3 percent every five years.
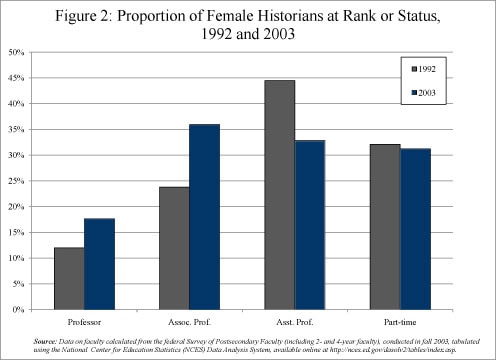
Figure 2
When the gender distribution of the faculty is further broken down by ranks, the latest federal survey reinforces this sense of slowing growth (Figure 2). Compared to a decade earlier, the cohort of women who entered the discipline in the late 1980s and early 1990s are moving into the higher ranks—as the proportion of women at the associate and full professor ranks increased by almost 50 percent over the prior decade. But there is a troubling drop in the proportion of women entering the field at the assistant professor level, which fell by more than 25 percent. Notably, the estimated proportion of female assistant professors in 2003 (at 32.8 percent) was lower than their representation among recent cohorts of new history PhDs (around 41 percent). This suggests that there may be some retrenchment in the recent gains for women over the coming decade—at the very least, there will be fewer women at the entry level who can later move up to the associate and full professor level.
The trends for minority historians among faculty are harder to discern, since their small numbers in the profession make even the best sample survey prone to a substantial margin for error. Nevertheless, the federal faculty survey indicates that minority historians made marked gains in the 1990s—growing from barely 9 percent of the history faculty in 1992 to almost 15 percent by 1998. As with the representation of women in the profession, the survey of faculty in 2003 indicates slowing growth, as the proportion of minority faculty rose only to 16.5 percent—an increase of 1.5 percent over the five-year period.
The survey estimates that 1.4 percent of history faculty were American Indian or Alaska natives, 5.4 percent were Asian American, 4.9 percent were African American, and 3.0 percent were Hispanic.
Problems in the Pipeline
Although attention to problems in the employment pipeline tends to focus on employment practices after the initial hire, the demographic imbalance in history seems to begin much earlier, in the mix of students drawn to history at the undergraduate level.
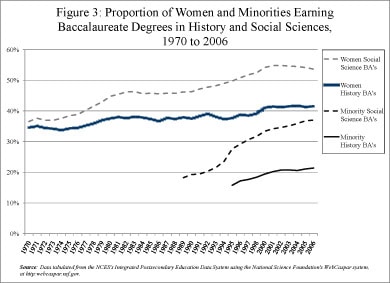
Figure 3
The rather unusual demographics of the history discipline become evident when we compare history to the other social science disciplines (Figure 3). The proportion of women earning degrees in all the social sciences was comparable to history back in the 1960s. But over the past 40 years, while the proportion of women earning social science degrees has become comparable to the larger American population, at a little over 50 percent, history’s share has remained near 41 percent.
The trend in the representation of minorities appears similar (though it should be noted that the Department of Education has been collecting the data for a shorter time). The representation of minorities among students earning baccalaureate degrees in the social sciences has grown from 18.3 percent in 1989 to 37 percent in 2006. The data for history as a separate field (which only goes back to 1995) shows modest growth, from 15.8 percent to 21.1 percent.
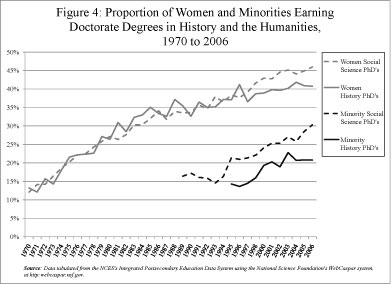
Figure 4
These trends are generally echoed in the trends among those earning doctoral degrees in history, though the shift toward greater demographic balance seems fairly static over the past decade (Figure 4). Most of that change occurred between the late 1960s and 1980, when the representation of women among new history PhDs expanded from 32 percent to about 38 to 39 percent. It was only by the late 1990s that history rose over the 40 percent mark, and it has essentially remained there ever since.
This is markedly different from the other humanities and social science disciplines. History has been similar to the social sciences in the representation of women over the past 40 years; but the social sciences moved ahead of history in the mid-1990s. Almost 45 percent of the social science doctoral degrees conferred from 2000 through 2006 have been received by women, while history appears to have reached a plateau near 41 percent. Among the humanities disciplines, women were already earning 42 percent of the doctorates by 1970, and they have been earning more than 50 percent of the degrees conferred every year over the past decade.
The proportion of minority students among new history doctoral students indicates greater change over the past decade—rising from around 14 percent to slightly more than 20 percent. Among the social sciences, the representation of new minority PhDs has been significantly higher, reaching 30 percent in the most recent year for which we have data.
Taken together, the data suggest that the history profession faces a number of challenges in its efforts to reflect the demographics of the population it serves. Even without delving into the problem of “leaks” in the pipeline (dropouts, career shifts, and so on), it appears that there are fundamental problems in the career conduits from the beginning.
The Pipeline in Academia
The data on the treatment of women and minorities in the academic job market is more ambiguous—at least at a statistical level.
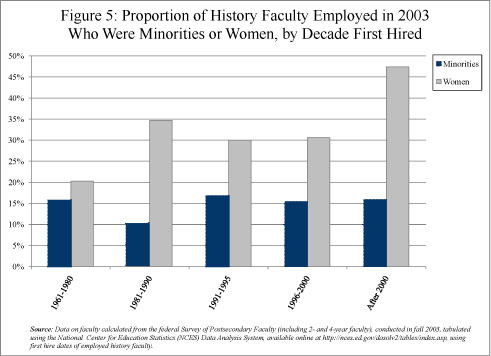
Figure 5
The 2003 federal faculty survey found that in the two years before the survey was taken, women had a slight advantage (over men) in getting hired, as 47.3 percent of the historians employed since 2000 were women (above their 41 percent share in recent cohorts of PhDs). However, for the cohort hired between 1996 and 2000, women were underrepresented relative to the proportion of women receiving history PhDs in those years—at less than a third of those employed in academia. That remained the case as well for those hired earlier, going back into the 1980s (Figure 5).
Among history faculty employed in 2003, the representation of minorities hired between 1996 and 2000 fell slightly below the proportion of minorities who had received history PhDs during that period. Only 16 percent of the most recent hires in history departments were minorities. As Figure 5 shows, among those hired in earlier years, the proportion of minority historians varied widely, from as low as 10 percent among those hired to their first jobs in the 1980s, to as high as 17 percent among those hired in the early 1990s.
These numbers need to be read with some caution. At least two factors at play here are difficult to determine with precision—how many of those who received history PhDs successfully entered the academic job market, and how many of those who were hired remained in the job market to 2003. It is not clear whether the gap between the closest PhD cohorts and those shown as employed in that period was the result of different hiring practices, or because a disproportionate number of women and minorities left employment in academia after they were hired.
When the salaries of women and men are broken down by rank there is only a modest difference in average salaries. On average, female historians at the full and associate professor level earn between one and two and a half percent less than their male counterparts. Meanwhile women earn an average of one and a half percent more than male historians at the assistant professor level, which suggests that at least a few departments are trying to address the gender imbalance in salaries.
When the total individual income for all sources is factored in, however (which takes into account income from publications, consulting, and the like) the gap between women and men grows significantly larger. In dollar terms, this amounts to a difference of about $6,000 a year at the full professor level and about $2,000 for assistant professors. This expands the average total income for men to between 7 and 10 percent higher than their female counterparts at each level.
Due to the small number of minority historians in the survey, comparable information for minority historians is not available.
Obviously these numbers reflect only quantitative data, and cannot indicate the actual lived experience of members of the profession. Members are encouraged to consider other recent reports from the AHA’s Committee on Women Historians and Committee on Minority Historians for related qualitative data.
Notes
- U.S. Department of Education, National Center for Education Statistics, 2004 National Study of Postsecondary Faculty (which includes both two- and four-year faculty), conducted in the 2003–04 academic year. Data from the study tabulated using the National Center for Education Statistics (NCES) Data Analysis System, available online at https://nces.ed.gov/dasolv2/tables/index.asp. [↩]