The remarkably large number of undergraduate students annually earning degrees in history continued apace into the 2007–08 academic year, according to the U.S. Department of Education.1 The number of graduate students earning degrees in history also increased sharply from the year before, but these gains seem to come at some cost in the diversity of the students earning degrees.
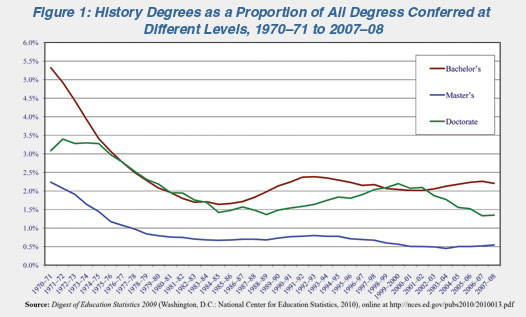
American colleges and universities conferred 34,441 bachelor’s degrees in history—just 5 less than the year before, and the second highest number of history BAs conferred in 35 years. For the first time in six years, however, the number of history degrees was essentially unchanged while the number of undergraduate degrees conferred in all of academia continued to grow. As a result, history now accounts only for 2.2 percent of all new undergraduate degrees conferred (Figure 1).
The history department at UCLA conferred the largest number of BA degrees in history by a wide margin—conferring 537 degrees as compared to the 300 degrees conferred by the University of Wisconsin–Madison, the next largest group of degree recipients. UCLA annually conferred more than 530 history bachelor’s degrees between 2005 and 2008, while the average number of degrees conferred by all history programs each year was 25.1.
At the graduate level, history programs conferred 3,403 master’s degrees in history. This represented an 8.2 percent increase from the year before, and took the number of new history MAs awarded to the highest level since 1976. George Mason University continues to confer the largest number of degrees from a traditional history department, but it is being surpassed by programs that use less traditional online and correspondence methods.
The number of doctoral degrees in history in 2008 increased 6.6 percent to 860 degrees, according to the Department of Education. This is troubling, given what we now know about the collapse of the job market over the next two years, but as the number of doctoral degrees conferred by other programs grew more rapidly, in relative terms this marked the lowest proportion of history doctoral degrees conferred in almost 40 years (just 1.35 percent). Even at the worst point of the job market crisis in the 1990s, the Department of Education had reported almost a thousand history doctorates conferred, which accounted for 2.20 percent of all degrees conferred then at that level.
The University of Chicago conferred the largest number of history doctoral degrees (40) in 2008, following two years in which Harvard held that distinction. Over the past five years, the average number of degrees conferred per program has declined from 6.8 to 5.5 per year.
While the number of new PhDs conferred remains quite high relative to the number of academic jobs available, there is evidence that the numbers are entering into a healthier balance for a normal academic job market. Thanks to the elevated number of undergraduate students earning history degrees, there are now 2.5 doctorates conferred for every 100 students earning undergraduate degrees in the field. This is actually much better than in the 1990s, when the ratio was above 4 doctorates for every 100 students. That is small comfort, however, as we wait for a return to some sense of normalcy in the employment picture for higher education, but it does indicate that PhD-granting departments responded sensibly to the job crisis of the 1990s by curtailing student admissions to their programs.
Among all disciplines, the ratio of doctorates to undergraduates has been fairly steady at around 4 percent, but this includes a number of disciplines that have significant job markets outside of academia. Until history departments develop similar tracks for employment outside of academia (in fields such as public history), they should consider this ratio of doctorates to undergraduates in the discipline when determining their admissions of new students into their programs and work to keep the ratio relatively low.
Demographics of New Degree Recipients
The federal data also allow us to look at broad trends in the racial and gender makeup of the students earning degrees, and show diverging trends on diversity.
In 2008, women comprised 41 percent of the new bachelor’s degrees in history. Not only did this signify a slight decrease from 41.3 percent the year before, but it was also the lowest level in a decade. At the same time, the representation of racial and ethnic minorities fell slightly—to 16.8 percent of the new degree recipients (from 16.9 percent in 2007).
In comparison, among the other social sciences, women comprised 51.5 percent of the baccalaureate degree recipients while racial and ethnic minorities account for 32.2 percent. Among all disciplines, women earned 57.3 percent of the degrees in 2008, and minorities received 25.3 percent of the new undergraduate degrees.
There are some marked differences within particular racial and ethnic groups that bear closer scrutiny as departments consider strategies for increasing diversity in their student population. Most notably, the data show, students from racial and ethnic minorities are significantly more likely to be women. Women were a majority (53.5 percent) among African American students earning undergraduate degrees in history, and a near majority (47.7 percent) among Asian American students (Figure 2). In comparison, among white, non-Hispanic degree recipients, women comprised slightly less than 40 percent of the new degree recipients.
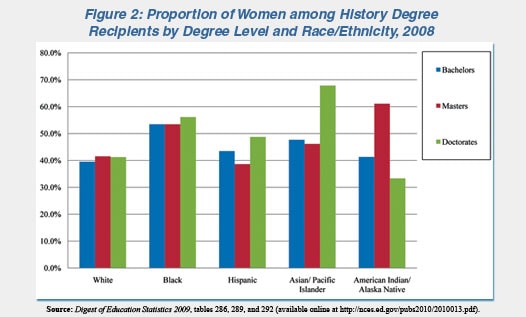
This trend carries up to the doctoral level, where women comprise 56.1 percent of all African American students earning doctoral degrees in history, 67.9 percent of Asian American degree recipients, and 48.8 percent of the Hispanic degree recipients.
This tendency toward higher levels of female degree earning among racial and ethnic minorities is consistent with the trend among other disciplines, but the ratios in other disciplines are much higher than in history. Among all disciplines, women earn 56.2 percent of the undergraduate degrees among whites, 65.7 percent among African Americans, and 54.6 percent among Asian American students.
Institutions and departments considering efforts to increase diversity among the student population in their graduate programs will, it seems, need to consider the particular composition of the student population emerging from the discipline at the undergraduate level.
Note
- Thomas D. Snyder and Sally A. Dillow, Digest of Education Statistics, 2009 (Washington, D.C.: National Center for Education Statistics, 2010). The analysis in this article relies particularly on Tables 286, 289, and 292. [↩]