The production of history PhDs dipped slightly in 1996, according to the latest data from the National Research Council (NRC), which reports that 857 PhDs were conferred-down from 889 the year before.1
This does not presage a trend however, as the number of PhDs reported in the 1997-98 Directory of History Departments rose by 18 percent after a similar dip between 1995 and 1996. This has been followed by a 13 percent drop in new PhDs in the 1998-99 Directory, published this October. At the same time, the number of graduate students in history PhD programs remains near the highest level since the mid-1980s, with 9,617 full-time, and 2,347 part-time graduate students reported working in the history PhD programs listed in the 1998-99 Directory. Of these, 3,967 were reported as working on their doctoral dissertations this fall.2
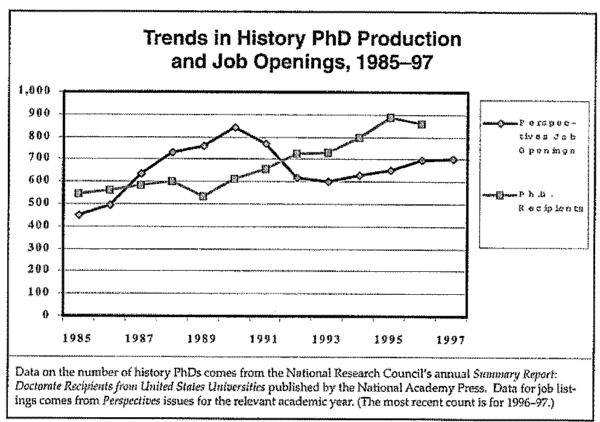
Figure 1
The decline in PhD production occurred as the production of jobs continued to improve, providing some narrowing of the gap between the production of PhDs and jobs (see figure 1). However, the percentage of history PhDs with “definite employment” after commencement fell to its lowest level ever in the survey, with only 46.3 percent reporting a job, and 36.2 reporting that they were still “seeking employment.”
On the positive side, among those who had landed jobs, the proportion that found teaching positions rose dramatically to 76.3 percent from just 60 percent the year before. In real terms, this meant that 52 more PhDs had found employment in the academy by the time they completed their degree. The data does not provide qualitative information on how many of these positions were full-time/tenure-track jobs or just short term/part-time employment. Of the large number that were not trying their hand in the job market (17.5 percent of the total in the survey) 5.8 percent reported they had secured postdoctoral study while another 3 percent said they were seeking postdoctoral study opportunities.
The NRC report included some other positive indicators. The proportion of women PhDs rose to 41.3 percent of the total, the highest level ever in the surveys. The percentage of minorities receiving history PhDs also rose to its highest level, 11.4 percent of the total.
The time spent pursuing the history PhD, which has been among the longest among all PhD cohorts, also declined to an average of 11.5 years after completing the baccalaureate degree (down from 12.1 years), and an average 8.6 years registering in graduate programs (down from 9 years).
Notes
- P. H. Henderson et al., Summary Report 1996: Doctorate Recipients from United States Universities (Washington, DC, 1998). [↩]
- Data tabulated by Robert B. Townsend from information provided by PhD-granting history departments to the 1982-83 through 1998-99 editions of the Directory of History Departments and Organizations (called the Guide to Departments of History until 1989). [↩]
This work is licensed under a Creative Commons Attribution-NonCommercial-NoDerivatives 4.0 International License. Attribution must provide author name, article title, Perspectives on History, date of publication, and a link to this page. This license applies only to the article, not to text or images used here by permission.