Over a thousand people earned doctorates in history in 2014—1,182, to be precise. This is 2 percent of almost 55,000 PhDs awarded by 426 US colleges and universities across all academe. History saw an increase of 2.3 percent from the previous year, slightly less than the 2.4 percent average increase in all fields. At a time of shrinking academic opportunities for historians—as Julia Brookins and Robert Townsend showed in the February 2016 issue of Perspectives on History—one might ask about the need for so many PhDs. But a deeper look into the data and beyond it reveals a rich fabric of pursuits and goals that enrich our academic and public culture in ways that numbers alone cannot measure.
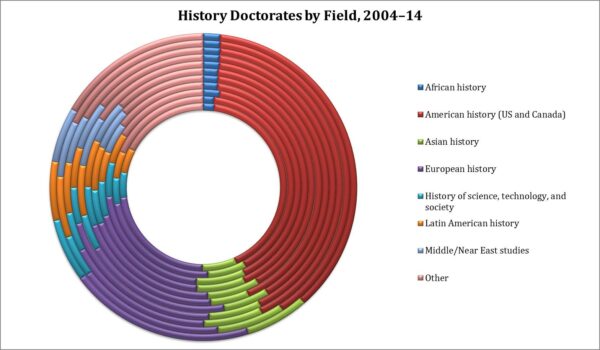
Figure 1: This chart shows 11 years of data, starting with 2004 in the innermost ring. Middle/Near East studies was added to the questionnaire in 2007. Source: Doctorate Recipients from US Universities: 2014, http://www.nsf.gov/statistics/2016/nsf16300/.
The Survey of Earned Doctorates (SED) collects data on individuals who complete research doctoral degrees from US academic institutions. It provides numerical information and broad demographic data about sex, ethnicity, race, and citizenship status, as well as time to degree, educational history, financial support, and plans after graduation. Federal government agencies, including the National Science Foundation, the National Institutes of Health, and the National Endowment for the Humanities, among others, gather this information annually through surveys. These agencies then produce the SED as part of their long-term analysis of the national research workforce across all fields. This priority limits the usefulness of the data for gaining a nuanced understanding of the shape of fields within our discipline, and it cannot speak to its practitioners’ goals and futures. Regardless of these limitations, it’s still worth exploring what the data can tell us about recent and long-term trends.
The complexity of our discipline, however, makes analysis difficult. The survey breaks down history into a very limited array of subfields that for the most part follow traditional geographical divisions. In reality, however, dissertations in a range of different fields cover historical topics. Furthermore, while the survey lists history as part of the humanities, “area/ethnic/cultural studies” is categorized under social sciences. The humanities also encompass “American/US studies” and “Jewish/Judaic studies and history,” both of which are home to historians but listed separately on the survey. PhDs in these areas contribute to historical knowledge in the United States and other parts of the world.
Trends in the numbers of candidates pursuing doctorates in these fields used by the SED don’t show any massive shifts in subfield interests over the past decade (fig. 1). American and European history still dominate dissertation topics reported by new PhDs upon completion of their doctorates, with other areas of the world making up a smaller but significant portion of the PhDs completed.
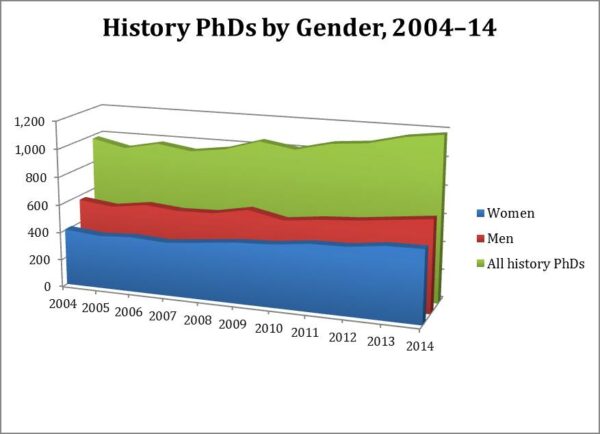
Figure 2: Since 2009, women have earned about 45 percent of all PhDs in history.
From 2004 to 2014, the numbers of both men and women earning PhDs in history gradually increased. While in absolute terms the number of women earning PhDs in history has grown faster than the number of men, the overall share has remained relatively static (fig. 2). The proportion of women hovered around 42 percent between 2004 and 2009. Since then, the figure has remained steady at about 45 percent. In 2014, men made up 55 percent of the PhD-earning cohort. Given the long-term trend from the 1960s of women making up a steadily larger proportion of the discipline, this leveling off could be seen as surprising.
On completion of their degree, 37 percent of history PhDs had secured “definite employment” other than a postdoctoral fellowship. This is slightly lower than the 42 percent average for all humanities fields, but marginally higher than the 36 percent of all PhDs nationally who had secured work upon completion. An additional 14 percent of the cohort had obtained some form of postdoctoral position, making the total securing work as a historian upon graduation 51 percent.
In history, of that 51 percent who had postgraduation commitments, 22 percent were going on to postdoctoral study, while 50 percent reported that they had secured “academic employment.” Nineteen percent listed their destination as nonacademic employment, which the survey defined as “industry, government, nonprofit, elementary or secondary school or other employment.” Figure 3 shows the employment trends from 2004 to 2014. When considering these figures, it is important to remember that the survey is completed on graduation, so it cannot provide a true picture of employment prospects for historians and their many career paths. A study, “The Many Careers of History PhDs,” published by the AHA in 2013, provides a far more descriptive account of over 2,500 people who earned their degrees between 1998 and 2009 (see www.historians.org/manycareers). This study found that almost the entire group had jobs, with over 70 percent working within the professoriate, and others working in a wide range of government, nonprofit, public history, and other educational roles.
So while a significant number of scholars are seeking jobs on completion of their doctorate, many of those still hunting for jobs at the time of survey completion will obtain employment in the coming months. I encourage caution about reading too much into job prospects in history based on the SED data. While securing jobs in any competitive field is never guaranteed, most history PhDs find professional success befitting their years of education. As the conclusion of the “Many Careers” report states, data such as that produced by the SED can only show where a specific cohort is at a given point in time.
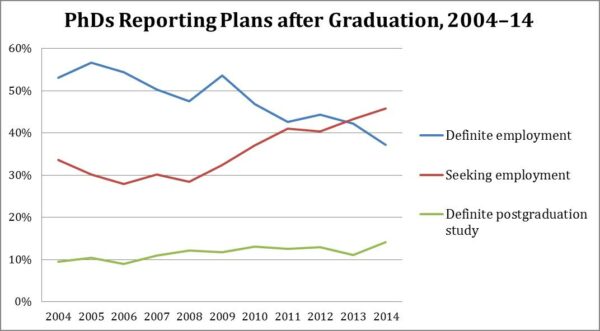
Figure 3: Reported plans of new history PhDs following graduation, 2004–14.
Ultimately, quantification only gets us so far. The SED doesn’t tell us about the value of this deep well of historical scholarship that year on year builds an ever more complex and detailed picture of historical transformation. Numbers of completions provide no understanding of the value to our culture, the enrichment of the individual, or the impact of such research. Bare numbers can give us trends in how fields expand and contract. They can also show us information about the interest in different fields by gender and other variables, but they cannot provide insight into the cultural, social, and personal contexts in which those trends happen. As humanists, we know how vital this deeper understanding is.
While individuals seeking PhDs and programs offering degrees should be aware of these numbers and factor them into their decision-making processes, the SED has limited use in predicting the future of any historian’s career. In 2014, almost 1,200 scholars completed a doctorate in history, each contributing a major work of scholarship to our discipline. They are embarking on careers as educators and scholars who, through their teaching, research, and writing (either within or outside the academy), will have an impact on our society. Let’s pay tribute to their achievement and recognize the importance that their collective effort has for public culture.
Survey of Earned Doctorates
This work is licensed under a Creative Commons Attribution-NonCommercial-NoDerivatives 4.0 International License. Attribution must provide author name, article title, Perspectives on History, date of publication, and a link to this page. This license applies only to the article, not to text or images used here by permission.