In 2022, the AHA conducted its seventh annual survey of undergraduate enrollment in history courses.
The survey is one part of a suite of AHA efforts to support history departments and programs as they seek to maintain and expand history education at their institutions. Each year from May until September, representatives from history departments and multidisciplinary programs that include history provide quantitative information about the total undergraduate student enrollment in all history courses for each of the past four academic years. History departments are asked to give basic information about their institution, and provide quantitative data on history enrollments, which includes students who take multiple courses multiple times, and counts only the history portion of cross-listed courses. The questionnaire also asks for optional information about a few of the variables that the AHA hypothesized might be influencing history enrollment trends at the macro level: these include dual credit and dual enrollment programs, faculty roles in actively recruiting students, and alumni engagement with the program or department. Respondents are also given space to offer comments, explanations, or questions of their own that help to illuminate what might be happening at the local level in each institution.
This process requires a department chair or other administrator or assistant to fill out a form, which, if they have the data at hand, takes approximately 20 minutes. This expenditure of time and effort is easier for those departments with more resources, and if too few institutions—or only well-funded institutions—participate, the resulting picture will necessarily be partial and incomplete. This year, we received only 79 complete responses, representing fewer than 250,000 students, compared to last year, where we received 138 complete responses representing more than 400,000 students. The quality of the responses was also less robust: in 2021, we received 54 optional final comments on the survey; this year, we received just 20 final comments. This comparatively low response rate and the fact that responding institutions are not broadly representative of the roughly 3,900 US colleges and universities (approximately 2,600 four-year and 1,300 two-year institutions) make it difficult to draw firm conclusions about recent changes in history enrollment.
With this substantial caveat, we observe that undergraduate enrollments have resumed their slow and steady decline. Over the late 2010s, undergraduate enrollment declined 2 percent per year on average. During the pandemic, however, undergraduate enrollments in history courses stabilized, at least when the steep decline in overall undergraduate student enrollment was taken into account. However, over the past year, this broader trend appears to have resumed. Undergraduate history enrollments at the 78 four-year colleges and universities in the United States and one institution in Canada that responded to the AHA’s survey declined 2.2 percent from the 2020–21 academic year to 2021–22 (Fig. 1). This decline occurred within a fairly stable overall undergraduate population, which decreased by only 0.6 percent from fall 2021 to fall 2022, according to data from the National Student Clearinghouse Research Center and reported in the Chronicle of Higher Education.
-600x481.jpg)
Fig. 1. Change in undergraduate history enrollment from prior year. AHA internal data
The limited reach and representativeness of the 2022 survey means that this decline should be read with caution. Because the AHA received a relatively small set of responses to our most recent survey, the results are especially sensitive to year-to-year variability at large institutions. Conversely, they tend to obscure changes at small institutions that involve fewer students, relatively speaking, but have a larger impact on the department.
Using the categories developed by the Carnegie Classifications of Institutions of Higher Education—which provide a framework for comparing diverse places of learning in the United States—we know more about what is going on at research-focused, doctoral universities than about the thousands of smaller, four-year institutions. Forty-two doctoral universities in the “high” and “very high” research activity categories provided data for this year’s survey; only 16 baccalaureate colleges and 20 institutions in the other Carnegie categories responded (Fig. 2). Sixty-one percent of responses came from programs that offered graduate-level courses in history, although those institutions are in the minority across higher education overall. There were no responses from two-year colleges, and only one from a Canadian institution.
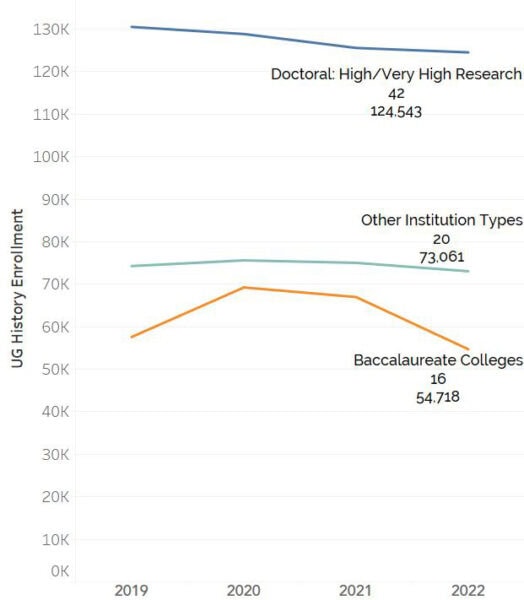
Fig. 2. Undergraduate history enrollment, 2019–22. AHA internal data
This smaller yield is likely due to a combination of factors that include lean staffing levels, difficulty accessing institutional data (especially at smaller departments), the perennial challenges of outreach to contacts at many two-year colleges, and other barriers to marketing the AHA’s survey to those individuals who could provide the most specific and illuminating answers. These limitations suggest that the AHA needs to do a better job recruiting responses from a wider range of institutions, even in the current environment of labor shortages and staff overwork. Broadening the survey’s reach could illuminate patterns that would assist history departments and history faculty across higher education.
Going forward, we are working to modify the enrollment questionnaire to increase the amount of basic data it collects, hoping to make it easier for overworked faculty and staff to respond. We will aim for a survey that takes respondents under 10 minutes to complete if they have the numerical data available. We will look for other approaches to gathering the in-depth, qualitative information from departments and historians that help to give texture and meaning to the raw numbers. The new survey will be available in May, as usual. If you are based at an institution that serves college undergraduates, please encourage your academic unit to provide accurate data that we can share with the history community.
The utility of our data depends on the quantity of responses. More complete data will enable us to do the analytical work necessary to engage the essential question, Why are enrollments declining, and how can we think creatively about reversing the trend? We hope to improve our understanding of the dynamics of change in higher education that are reshaping opportunities across our discipline.
This work is licensed under a Creative Commons Attribution-NonCommercial-NoDerivatives 4.0 International License. Attribution must provide author name, article title, Perspectives on History, date of publication, and a link to this page. This license applies only to the article, not to text or images used here by permission.