For the third year in a row, salaries for history faculty grew faster than inflation, according to the most recent data from the College and University Personnel Association (CUPA). For many in the profession, the recent salary gains have made up for years of meager salary adjustments in the early 1990s that had history faculty losing ground to inflation.1
Not all of the news from CUPA is as heartening, however. Their data shows a widening gap between the best and least paid members of the profession, and also indicates a disturbing drop in the number of new assistant professors hired in history departments last year.
The CUPA salary figures are based on a 9- or 10-month academic year salary for faculty working over 51 percent time. The figure does not include fringe benefits, perquisites, and other outside income like summer employment. The CUPA survey is the only national report that provides salary data on specific disciplines. Unfortunately, it divides the data into separate surveys of private and public institutions, and does not differentiate between different types of academic institutions.
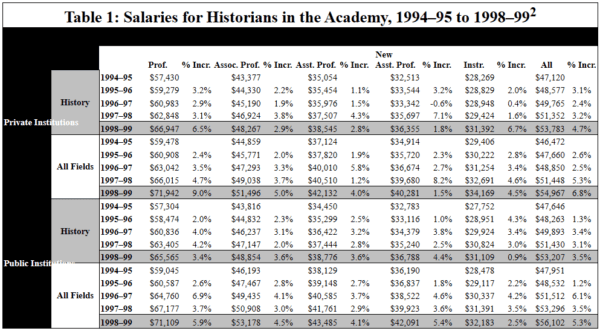
Table 1
The CUPA surveys for 1998–99 found that the average salary for historians at private colleges and universities rose to $53,783—a 4.7 percent increase. The average salary for historians at public institutions saw a more modest increase of 3.5 percent, rising to $53,207. As the data in Table 1 indicates, this improvement was enjoyed at almost every level. With the exception of instructors at public institutions, these salary increases translate into real gains for history faculty at all levels when set against the modest 1.6 percent increase in the national cost of living.
However, the CUPA findings also contain some surprises. This represents the first time since CUPA began conducting the survey 17 years ago that average salaries for historians at private colleges and universities surpassed those of their counterparts at public institutions.
These gains for historians at private colleges and universities are somewhat deceptive, however, as recent salary adjustments have gone disproportionately to faculty at the full professor level, where the largest cohort with the largest salaries have enjoyed some of the largest raises.
As in past years, full professors received strong 6.5 percent increases last year, while history faculty at the associate and assistant professor levels lagged well behind with increases of less than 3 percent (Table 1). Faculty at the instructor level enjoyed significant 6.7 percent increases, but this follows six years in which they lagged significantly behind inflation.
By contrast, at public colleges and universities there was a much more equitable distribution of salary increases among the ranks of history faculty. Full professors actually received smaller salary adjustments than associate and assistant professors. However, history faculty at the instructor level (2.7 percent of the total) actually lost ground relative to inflation, with only a modest 0.9 percent increase in average salary.
Growing Salary Gap in History
Even though aggregate salary adjustments at public institutions have been more equitable between the ranks, the gap between historians at the highest ranks and the lowest has become more acute. At public colleges and universities the highest paid history professor made nine times the salary of the lowest paid instructor ($167,118 compared to just $18,000). The gap between the highest and lowest paid history faculty at private institutions is only slightly smaller, as the highest paid history professor received almost eight times the salary of the lowest paid history instructor ($155,580 compared to just $19,785).
This gap has grown sharply over the past 10 years, particularly at public institutions where the disparity more than doubled. In 1988–89, the salary of the highest paid history professor at public college was 3.4 times as much as the lowest paid historian ($85,600 as compared to $16,008).
The difference between historians at different ranks has grown less dramatically at private institutions. In 1988–89, the highest paid history professor made 6.3 times as much as the lowest paid historian ($95,883 as compared to $15,091).
Mixed News from the AAUP
Because of changes in the number of disciplines included in the CUPA survey (most notably the addition of 25 high-paying disciplines), there is no aggregate data for the academy by which to measure the improvements in history. However, a much wider salary survey by the American Association of University Professors (AAUP) found a similar 3.6 percent increase in average salaries for faculty at public and private institutions, as well as two-year colleges (which are excluded from the CUPA survey).2
Salary increases were smallest at MA-granting “comprehensive” institutions, rising by just 2.6 percent. Faculty at two-year colleges did not fare much better, with an average 2.7 percent increase. Not surprisingly, faculty at doctorate-granting institutions did the best, averaging 4.2 percent in salary gains.
Unlike the CUPA surveys, the AAUP report does not provide discipline-specific information, but it does take into account all forms of compensation, including fringe benefits and summer wages.
According to the AAUP, the average faculty salary in higher education is $56,282, with an average of $13,605 in additional benefits and compensation (including insurance, retirement, Social Security, and tuition). For ranked faculty, the highest average salaries were in doctoral programs, where faculty average $64,594 with $15,412 in additional benefits. The lowest average salaries were at two-year institutions where salaries average $45,653 with an additional $11,582 in benefits.
Disturbing Evidence of Reduced Hiring
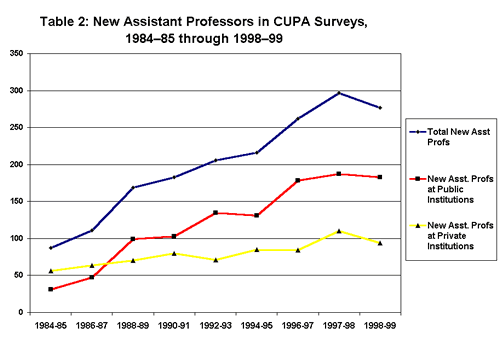
Figure 2
The most troubling development revealed in the CUPA data concerns the hiring of junior history faculty, as the number of new assistant professors reported hired fell for the first time in three years (Table 2). New assistant professors in the CUPA taxonomy include all those hired to, or promoted to, the assistant professor rank in the 1997–98 academic year. This reinforces AHA data reported earlier this year, which noted a slight decline in the number of new assistant professors hired in the last edition of the Directory of History Departments.3
The proportion of history departments hiring new assistant professors fell from 29.6 percent of history departments to 27.7 last year, and the number of new assistant professors hired fell to 277 from 297 the year before. While these declines are relatively modest, the CUPA surveys had been tracking significant increases until this year.
While the drop was slight in absolute terms, it is troubling given the dramatic increase in the number of history PhDs awarded and the long-nurtured expectations of a significant expansion in recruitment. In a report released this past July, the National Science Foundation reported the number of history PhDs shot up from 857 conferred in 1996 to 954 conferred in 1997. The latter numbers will be assessed in detail in next month’s issue of Perspectives.
Notes
- CUPA, National Faculty Salary Survey by Discipline and Rank in Private Colleges and Universities (published annually for the academic years 1986–87 through 1998–99), and CUPA, National Faculty Salary Survey by Discipline and Rank in Public Colleges and Universities (published annually for the academic years 1986–87 through 1998–99). Salary figures are based on a nine- or ten-month academic year, full-time faculty only. Fringe benefits and summer earnings are excluded. Copies can be obtained from CUPA at 1233 20th St. NW, Ste. 301, Washington, DC 20036-1250, (202) 429-0311. [↩]
- American Association of University Professors, “Ups and Downs: The Annual Report on the Economic Status of the Profession, 1998–98,” Academe 85:2 (March-April 1999). Copies can be obtained by contacting the AAUP at 1012 14th St., NW, Ste. 500, Washington, DC 20005. (202) 737-5900. [↩]
- See Robert B. Townsend, “1998 Job Market Report: Retirements Create More Opportunities but Job Gap Remains,” Perspectives (January 1999), 3–24. [↩]