The number of history PhDs produced in 1997 reached the highest level in two decades, according to the principal survey of PhD production. The data collected for five federal agencies by the National Opinion Research Center (NORC), reports that 954 history PhDs were conferred in 1997—up from 857 the year before.1
Related data indicates that this trend is likely to continue in the short term, despite sharp reductions in graduate student admissions since the mid-1990s. Because of the long time it takes to get a history PhD (more than eight years, according to NORC), enrollments only began to decline significantly last year. As a result, the rising tide of history PhDs will continue for at least a few more years, as the large numbers of graduate students that entered programs in the early 1990s finish their degrees.
Trend toward Short-Term Growth
The increase in history PhDs is part of a larger pattern of growth in overall PhD production, as the number of doctorates produced at U.S. institutions rose to its highest level ever—42,705 in all disciplines, up slightly from 42,415 the year before. However, while PhD production for all fields is 32 percent above 1987 figures, history PhD production rose more dramatically, by 63 percent over the same period. This growth surpasses every other humanities and social science discipline—only English language and literature is even close, with growth of 61 percent. In comparison, political science PhDs increased by 51 percent, foreign language PhDs rose 47 percent, and anthropology/sociology PhDs increased by 29 percent. Only the production of PhDs in computer sciences and health science grew faster, at 98 percent and 73 percent respectively. Engineering PhDs also rose by 63 percent.
Figure 1
In the short term, the upward trend in history PhDs appears likely to continue. PhDs listed in the Directory of History Departments for 1998 and 1999 increased slightly (a slight 4 percent decrease in 1998 followed by an 11 percent jump in 1999).2 Because the NORC figure counts history PhDs produced in specialized and nonhistory departments, it tends to be about 10 percent higher than the Directory count. However, changes indicated by the Directory data have been a good predictor of the overall trend and direction the federal figures. If this bears out (see Figure 1), the NORC figure for 1999 appears likely to pass over 1,000 for the first time since 1977. The Directory‘s count of PhDs produced at U.S. history departments rose from 858 in 1997 to 911 in 1999.
A growing number of dissertations in progress provides further evidence of this growing wave of new history PhDs (dissertation in progress information is collected with the Directory information, but now published online.) The number of PhD candidates with approved dissertation topics rose from 3,967 to 4,088 this past year.
Signs of a Coming Drop in History PhD Production
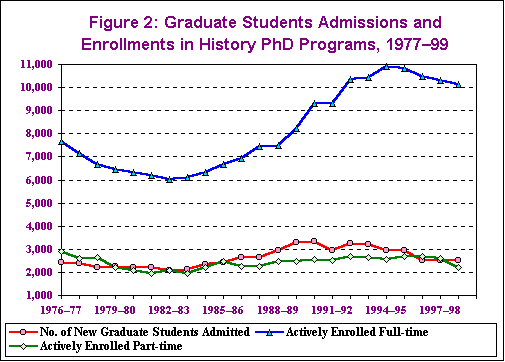
However, these are all short-term indicators. All of the long-term evidence indicates that this high tide of history PhD production will soon recede, and recede quite rapidly early in the next decade. The number of graduate students in PhD-granting history departments plummeted last year, as admissions of new graduate students fell to its lowest point in 13 years.

Figure 2
In the late 1980s and early 1990s there was a great deal of optimism about the history job market, and even talk of a coming “PhD shortage” by the decade’s end. As a result, admissions of new graduate students to history PhD programs shot up 60 percent between 1984 and 1992 (see Figure 2). During the recession of 1992, as the disparity between PhDs produced and the number of job openings grew sharply (Figure 1), and expectations for the history job market became decidedly more pessimistic. In 1993 and 1994, history departments began to cut back on graduate student admissions. Subsequent admissions of new graduate students to history PhD programs fell 25 percent between 1993 and 1999, to just 2,525.
An increase of 12 new PhD programs over the past six years (fifteen new programs were created while three history PhD programs were eliminated) slowed the effort to reduce graduate student admissions. The 15 new PhD programs accounted for almost nine percent of the new admissions this past year.
Below the surface, however, important changes are now taking place. After modest declines the past few years, the number of graduate students in history PhD programs fell sharply last year, to its lowest level in almost eight years (Figure 2). Last year there were 10,155 graduate students working full time and 2,219 working part time in U.S. PhD-granting history programs. This represents a decline of 569 from the year before, with an average of 4 fewer graduate students at each program. Of the 147 PhD-granting history departments in the United States, 82 experienced a drop in the number of actively enrolled graduate students.

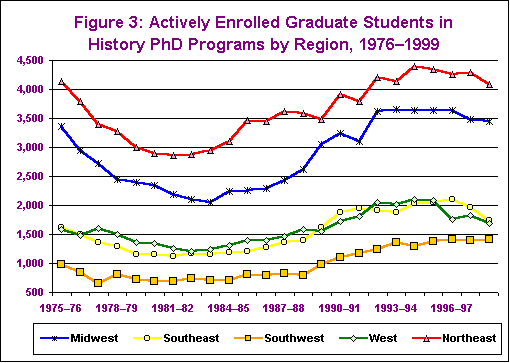
Figure 3
However, there are significant differences in the trends taking place at the regional level (Figure 3). In the West, the number of actively enrolled graduate students in history PhD programs fell by 20 percent over the past five years. In contrast, the number of history graduate students in the Northeast fell by less than 7 percent, and declined 5.5 percent in the Midwest. In the Southwest, the number actually rose 9 percent with the opening of new history PhD programs in Texas and Nevada.
A similar disparity appears between PhD programs at public and private institutions. The number of history graduate students at public universities fell almost 12 percent over the past five years. This compares to an increase of almost 1 percent at private universities.
The data also suggests that potential graduate students are thinking twice about entering history PhD programs. During the period of rising expectations in the late 1980s and early 1990s, new admissions consistently ran 3 to 6 percent above initial projections by the departments (each spring departments are asked to estimate the number of new graduate admissions in the coming fall term). Since expectations for the job market turned sour in 1993, admissions to PhD programs have averaged around 2 percent below departments’ initial expectations.
Demographics of the 1997 PhD Cohort
The demographic data provided in the NORC survey of 1997 history PhDs points to a reversal of the recent positive trends in the representation of women and in average time to degree. At the same time, the indicators for the employment prospects of new PhDs continue to sag.
After rising to 41.3 percent in 1996—the highest percentage ever recorded in the NRC surveys—the proportion of women fell back to 37.1 percent in 1997. This marked the first reversal of a trend going back almost five years. The percentage of minorities receiving history PhDs held steady at its historical high point, 11.4 percent of the total.
The time spent pursuing the history PhD rose slightly to an average of 11.6 years after completing the baccalaureate degree (up from 11.5 years), and an average of 9 years registered in graduate programs (up from 8.6 years). Both figures had declined in the previous year.

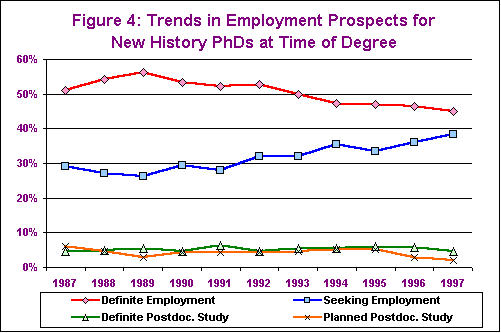
Figure 4
The NORC survey also examined immediate employment prospects, and theresponses reinforce the concerns about the job market. For the eighth year, the proportion of new history PhDs reporting “definite employment” at the time of degree fell to a new low of 45 percent, down from just over 46 percent the year before, and from 51.1 percent in 1989 (see Figure 4). The proportion still “seeking” employment rose to a new high of 38.5 percent (up from 36.2 percent in 1996 and 29 percent in 1989).
As reflected in Figure 1, recent and ongoing improvements in the number of job listings have failed to keep pace with the growth in the number of new history PhDs. The data on new job openings and changing employment trends in the academy (as reflected in the new Directory) will be explored in greater depth in next month’s issue of Perspectives.
Notes
- Allen R. Sanderson and Bernard Dugoni, Summary Report 1997: Doctorate Recipients from United States Universities (Chicago: National Opinion Research Center, 1999). NORC took over data collection from the National Research Council, which had conducted the survey since 1977. [↩]
- Data tabulated by AHA staff from information provided by PhD-granting history departments to the 1982–83 through 1999–2000 editions of the Directory of History Departments and Organizations (called the Guide to Departments of History until 1989). Figures exclude specialized history programs (such as departments of ancient history, Jewish history, and the history of science), most of which have only been listed for a few years, and which have not listed as consistently as the nonspecialized history departments. To retain a measure of comparability with the federal figures, the count also excludes figures from Canadian departments. [↩]

