Undergraduate history enrollment trends at colleges and universities in the United States and Canada continue to range widely from one institution to another, but there have been only small changes to the overall number of students taking history courses in recent years. In the latest AHA Enrollment Survey, conducted between May and September 2020, respondents from 113 institutions provided information about enrollments for the past four academic years. The total number of undergraduate history enrollments represented in these survey responses declined by 1.36 percent: from 338,150 in 2016–17 to 333,568 in 2019–20 (Fig. 1).
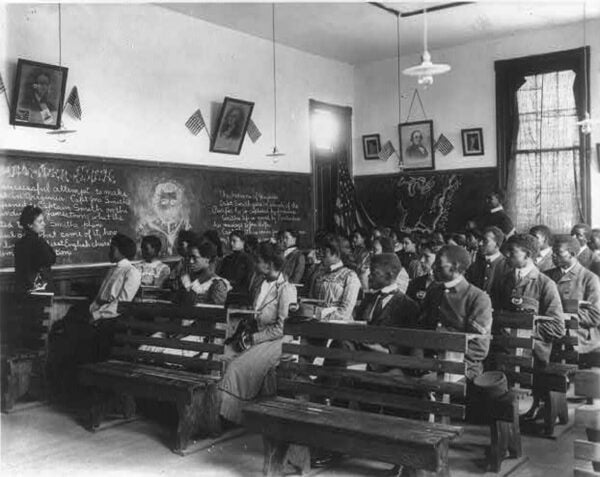
History students at the Tuskegee Institute in 1902. Frances Benjamin Johnston/Library of Congress
Of course, the year that just concluded was deeply unusual. Though the data presented here include spring 2020, most students attending college in March remained enrolled through the end of the spring term, so the bulk of pandemic-related disruptions are not yet visible in the numbers. We expect to see the changes to higher education wrought by the coronavirus pandemic reflected in next year’s responses.
Some readers surveying our data from the pre-pandemic past—especially those who have been following the dramatic slide in the number of history majors for many years—might be heartened to find here a change of only 1 percent. After rising 1.26 percent two years ago, enrollment fell 1.26 percent the next year, then fell again 1.35 percent. But a closer look suggests trouble ahead. While enrollments add up pretty closely for 2018–19 and 2019–20, examining responses by institution type reveals more significant declines in almost all categories, with broader declines offset by relative stability at research universities, which tend to be larger and are overrepresented in number among AHA survey respondents. Across the 23 baccalaureate colleges that participated, for example, enrollment declined more than 6 percent in the last year, following two years of declines totaling less than one-half of 1 percent.
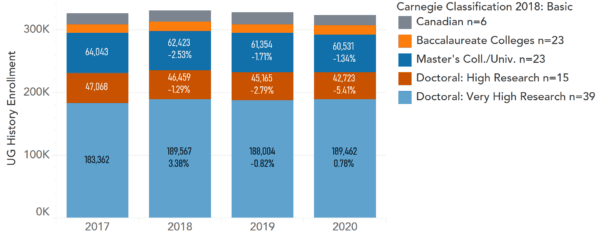
Fig. 1: Undergraduate history enrollment by institution type (n = 113)
While this survey is open to any history unit (or joint unit that includes history), responses came from 107 four-year institutions in the United States and six Canadian universities. To display the Carnegie classifications here, the six Canadian universities are grouped separately. While imperfect, the AHA vantage point can help to discern patterns both in the external, structural changes that are affecting history programs and in the actions undertaken by faculty, staff, students, and alumni who are working to fend off more severe declines.
Within the apparent stability of the new totals were huge variations between campuses and annual declines in all but one institutional category: Very High Research Doctoral Universities. This institution type is the largest category in our survey responses, and the stability of history programs within it has largely offset bigger percentage changes on many smaller campuses. In the past year, declines led advances by three to two: 67 responding institutions saw declines in enrollment since last year, 45 saw increases, and one had level enrollment. Over the past four years, history enrollments have fallen at some institutions (even a few large ones) by totals of 30 percent or even 53 percent; at others, enrollment has risen by up to 53 percent.
The bulk of pandemic-related disruptions are not yet visible in the numbers.
Even among the 15 High Research and 39 Very High Research Universities, we can see a difference in the fortunes of history at public versus private institutions. At the 13 private research institutions, history enrollments were up 3.47 percent last year and 0.4 percent the previous year; at the 41 public research institutions (a much larger group), enrollment was down around 1 percent last year, after falling 1.4 percent the year before (Fig. 2).
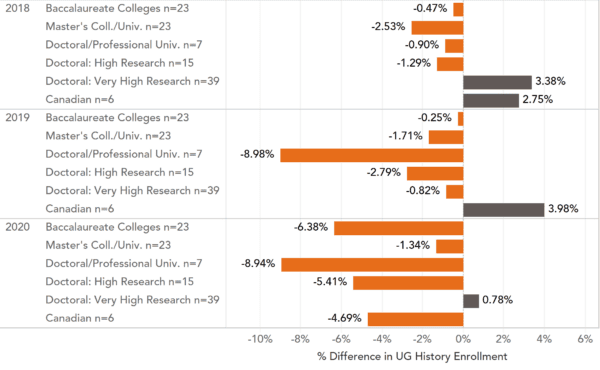
Fig. 2: Change from previous year by institution type (US) or country
The general enrollment trend in history, as in most fields, is composed of smaller, sometimes unrelated trends that have an impact on how difficult a given intervention might be: the number of history majors and minors; students enrolling to fulfill general education requirements or taking courses to meet the requirements of other majors (education, for example, or a global studies program); and students choosing to take history courses as electives. The numerical significance of each stream of potential students will vary by department. Chairs, faculty members, and advisers have only so much capacity to pursue recruitment strategies and will report mixed success depending on the quality of the data used to develop a strategy and on the elasticity of student demand for history courses. A session on recruitment at the 2020 AHA annual meeting (described by Rachel Feinmark in the April 2020 issue of Perspectives on History) found that a common thread among different successful enrollment initiatives was the investment of time and care in building a strong sense of disciplinary community and belonging for students in history.
There were huge variations between campuses and annual declines in all but one institutional category.
Some more curricular-focused approaches might include offering popular courses more consistently, developing courses or tracks that appeal to students in popular majors (such as business, health sciences, law, and criminal justice), and identifying students who are not thriving in their chosen majors but harbor a love of history. One institution that has tried working on several fronts reports:
Our enrollments have been increasing over the last several years (10 percent increase from 2019 to 2020). Why? In part, to be honest, because of the arrival in 2016 of a German historian who teaches a course on Hitler’s Germany (he pulled 100 students last time—10 percent of our yearly enrollment). But, in part, we’ve been marketing a bit more aggressively and trying to offer new courses on topics of more interest to students [and cutting some surveys].
The mix of tactics looks different elsewhere:
In fall of 2017, we introduced a new Law, History, and Society major that is administered by the History Department. It has proven to be very popular and our numbers of majors have grown steadily. We now have 79 LHS majors, in addition to 100 History majors and 64 Economics and History majors. We also boosted enrollment in our minor by revising the requirements in 2017 to allow students to read deeply and broadly with greater choice, while adding a methods class. Finally, we found that teaching introductory writing courses in the History Department and reserving seats in our most popular lecture classes for first- and second-year students have been effective recruitment measures.
In some cases, the reasons for positive change remain unclear:
As the figures earlier demonstrated, our undergraduate enrollments have continued to increase over the last five years. This has occurred while we could easily have experienced a decline in overall enrollment. We have lost many faculty to retirement, have been obeying austerity measures, and have experienced decreasing institutional support for the Humanities and Humanistic Social Sciences. Our number of majors have stayed steady but not increased. We have been working on increasing our underrepresented minority students both in our major and in our students taking courses, but this too has remained relatively constant over the last five years.
Conversations with department chairs suggest that enrollment concerns are a top priority for many history departments, and the AHA’s virtual chairs seminars have proven a fertile ground for chairs to share enrollment strategies. Still, systematic research on key variables driving enrollment changes remains scarce. While respondents share their sense of what might be causing their enrollment numbers to rise or fall in a given year or over time, survey responses reveal little evidence of institutions or academic units working to discover the underlying patterns of those enrollment choices via systematic inquiry.
Systematic research on key variables driving enrollment changes remains scarce.
Certainly the impressions of faculty and staff members with deep experience in course offerings, instructional staffing, class scheduling, and registration numbers are a starting point. Many departments have implemented strategies to recruit and retain more history majors or to market individual courses with a presumed popular appeal. But if respondents with access to local data and help from staff in institutional research or college-wide advising came up with a set of questions about what variables encourage students to enroll in history courses—and were empowered to collect the relevant data to answer them—the entire history community would benefit.
This work is licensed under a Creative Commons Attribution-NonCommercial-NoDerivatives 4.0 International License. Attribution must provide author name, article title, Perspectives on History, date of publication, and a link to this page. This license applies only to the article, not to text or images used here by permission.