Editor’s Note: Please note that this is an extended version of the article that first appeared in the January 2007 print edition.
We often speak in anecdotal terms about changes in the profession over the past generation—speculating about the rise of cultural and women’s history, for instance, and wondering about the health of European history. An AHA staff survey of faculty field specializations listed in the Directory of History Departments (and its precursor, the Guide to Departments of History) since 1975 provides more tangible evidence of these changes.
In broad terms, the data serve to confirm many of the anecdotal impressions. For example, a smaller proportion of the academic historians listed in the Directory label their fields as economic and diplomatic history (whose practitioners often lament their waning influence in the discipline), while the proportion of history faculty working on some aspect of European history also declined over the past 30 years (though perhaps less than one would expect).
To obtain this data, AHA staff scanned in the faculty listings submitted to the Guide/Directory from 1975 to 2005 at five-year intervals, and used text-searching software to identify faculty members who labeled their work as falling into one of 11 particular topical specializations, and the proportion who described their work in one of six geographic regions (or the world).1
This sampling method is admittedly rather crude. Not all faculty members identify their work with a particular label (“social” or “intellectual” history, for instance) even though their publications and teaching would generally be recognized as falling into that field. At the same time, the underlying meanings of many of these labels have changed over the past generation. Nevertheless, the data collected shows significant changes in the popularity of particular labels historians choose to describe their areas of interest.
Tides of Topical Change
The largest changes over the past generation seemed to occur in the selection of topical fields. To measure these changes, we singled out field labels that seemed to hold some conceptual continuity between 1975 and 2005, and had been selected by more than 2 percent of the faculty in 1975 or 2005. In cases where a different label was adopted to cover all or part of the same category—”black,” “Afro-American,” and “African American” history, for instance, or “diplomatic” and “international” history—each term was included in the search.
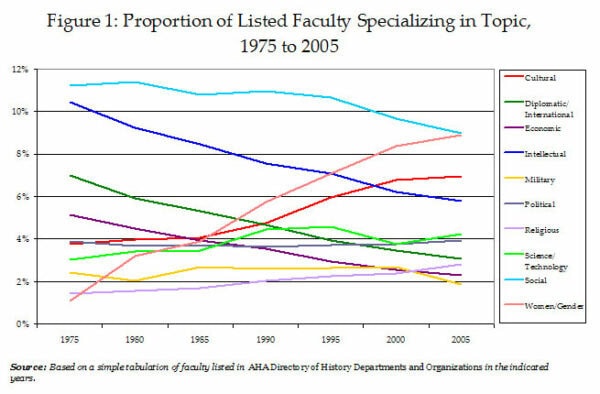
Figure 1
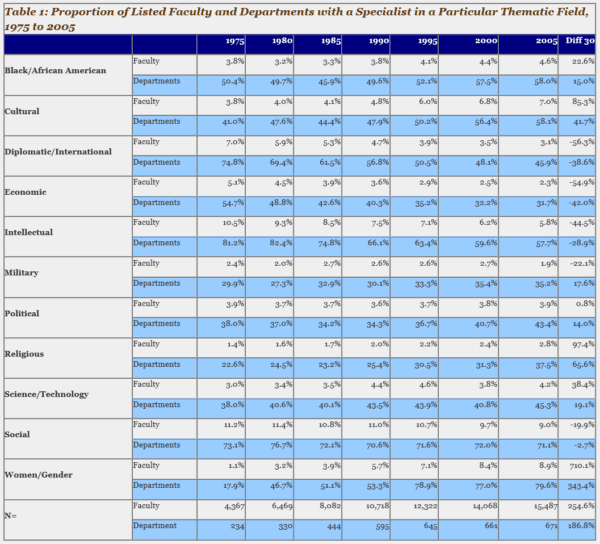
As shown in Figure 1 and 2, the use of a number of field designations changed significantly over the past 30 years. (See Table 1 for specific numbers.) Two fields that often describe themselves as fairly beleaguered in the discipline—diplomatic and economic history—declined by almost half of their proportion of the listed faculty. Diplomatic and international history fell from 7.0 percent of the listed faculty in 1975 to 3.1 percent of the faculty listed in 2005. Economic history declined from 5.1 percent of faculty listings to 2.3 percent.
The proportion of departments with at least one faculty member designated in one of these two fields also fell. In 1975, 54.7 percent of the departments reported an economic historian. That fell to 31.7 in 2005. Similarly, thirty years ago 74.8 percent of departments listed at least one diplomatic historian, but only 45.9 percent did so in 2005.
Two other fields that are often described as beleaguered—political and military history—showed comparatively little change over the past 30 years (and hence are not shown in the print version of the chart). The proportion of political historians listed stood at 3.9 percent of the faculty in both 1975 and 2005; the proportion of military historians increased slightly, from 2.4 to 2.6 percent over that span. And contrary to perceptions, the proportions of departments listing at least one specialist in the two fields actually increased—from 38 to 43.4 percent, in the case of political history, and from 29.9 to 36.2 percent for military history.
In contrast, intellectual history—a field that seems relatively strong in terms of journal and book production—fell steadily in the proportion of listed faculty over the past 30 years. The proportion of listed faculty fell almost 50 percent (from 10.5 to 5.8 percent), and the proportion of departments with at least one identified intellectual historian fell by almost 30 percent (from 81.2 percent to 57.7 percent).
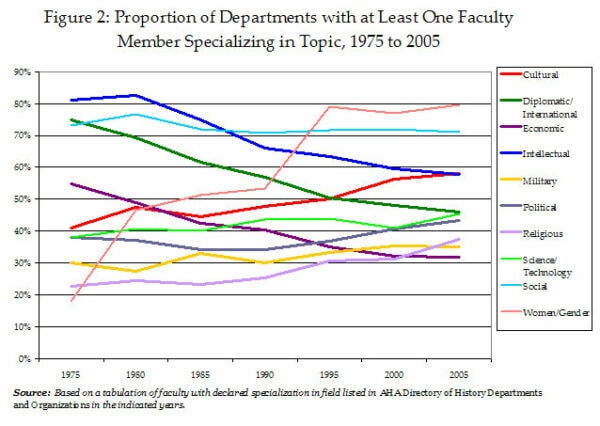
Figure 2
Ironically, this apparently significant decline also suggests the need for some caution in reading these numbers. The blurring of the conceptual borders between “intellectual history” and other rising fields such as cultural and religious history means that it is often difficult to track particular categories of faculty interest over time. Much of the apparent decline in the number of people selecting social history, for instance, may actually reflect differentiation into emerging subfields like women, gender, and ethnicity. And as the letters in this issue on the Council’s decision to drop psychohistory from the printed renewal forms (to make room for a category that would elicit selection by more than four members), historians often identify with particular fields even when they might not specifically select them.
Nevertheless, the data does chart the marked ascent of a number of other topical specializations that are generally assumed to be on the rise. The proportion of listed historians specializing in the history of women and gender, for instance, grew more than eight fold over the past 30 years. In 1975 only 1.1 percent of the listed faculty indicated “women” or “gender” as a field of specialization. By 2005 that number increased to 8.9 percent of the historians listed. And the proportion of departments with at least one faculty member in the field grew from 17.9 percent in 1975 to 79.6 percent in the 2005 Directory.
These tabulations also show the recent rise of cultural history. The proportion of historians working on some aspect of culture increased only slightly between 1975 and 1990—growing from 3.8 percent of the faculty to 4.8 percent. Since that time, however, the proportion of cultural historians increased to 7.0 percent. The proportion of departments with cultural historians only grew from 41.0 percent to 58.1 percent.
One other field that is not often noted in discussions about the rising and falling fortunes of particular fields is religious history, which doubled over the past 30 years, from 1.4 to 2.8 percent of the listed faculty. The proportion of departments with at least one specialist grew to 37.5 percent of the departments, now surpassing the proportion with an identified economic or military historian.
The Decline of European History?
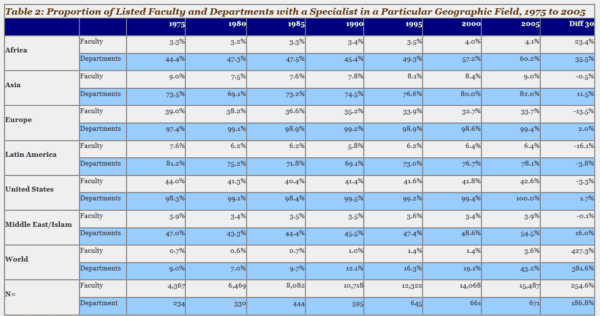
In contrast to the trends in the topical specializations, among the geographic field specializations the most notable trend seems to be continuity (Figures 3 and4 and Table 2). The proportion of historians teaching European history fell modestly, while the percentage of historians teaching African and world history increased.
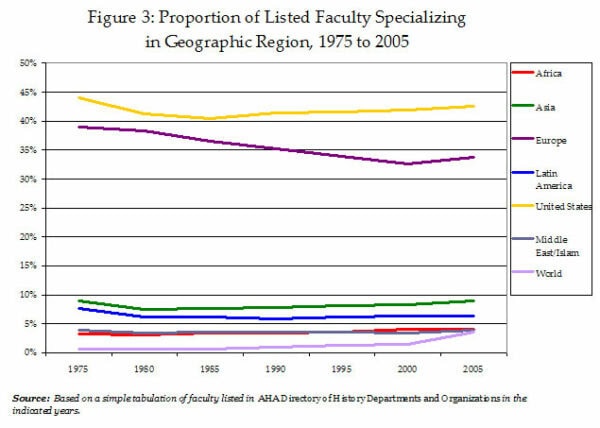
Figure 3
At the AHA headquarters we tend to receive the largest number of calls from historians of Europe, who wonder about whether their field is being squeezed by the growing emphasis on other regions of the world. This survey does show that proportion of historians employed in departments working in the field of European history did decline by a bit more than 13 percent over the past 30 years, from 39.0 percent of the listed faculty to 33.7 percent. The proportion of departments with at least one European historian remains essentially unchanged at nearly 100 percent.
These numbers need to be read with some caution, as there is a tendency among many of our correspondents to assume that these trends mark a zero-sum game—that increases in the number of specialists in regions like Africa, Asia, or Latin America have to come at the expense of a field like European history. In reading these percentages, it is important to keep in mind that the number of historians teaching in American colleges and universities more than doubled over this span. So even with a modestly smaller slice of the pie, the actual number of historians employed in European history still increased significantly.
Analysis of the figures is further complicated by the growing number of faculty teaching in a part-time or adjunct capacity. What we do learn from the data in the 2005–06 Directory is that European historians are less likely to be employed in a part-time capacity than faculty in most of the other geographic fields.
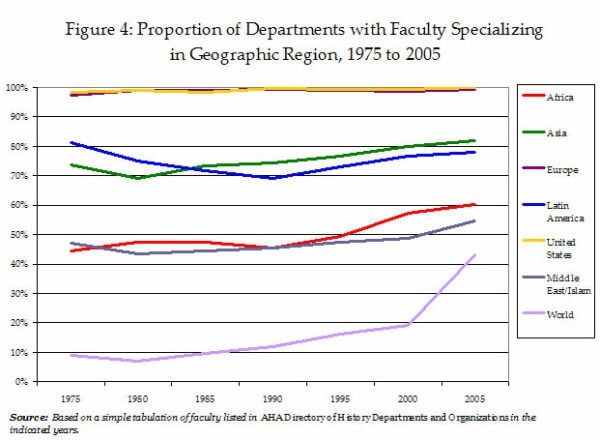
Figure 4
In proportional terms, the regional field that seemed to lose the most ground was Latin America, where the proportion of specialists listed was 16.1 percent lower in 2005 than in 1975—from 7.6 percent of the faculty listed to 6.4 percent. The field has been rising in recent years, however, after reaching a low of just 5.8 percent of the listed faculty in 1990.
In comparison, the fields of African and world history have gained significantly over the past 30 years. The proportion of Africa history specialists grew from 3.3 percent to 4.1 percent of the listed faculty, and the proportion of departments with an Africa specialist grew from 44.4 percent to 60.2 percent.
The growth in the field of world history is more recent. Thirty years ago, less than one percent of the faculty listed world history as a field, and they tended to be limited to the junior and adjunct ranks. In 2005, 3.6 percent of the faculty listed world history as a field, and a significant portion of them were employed at the associate and full professor level (though this is still disproportionately selected by adjunct faculty).
The fields of Asia and the Middle East are essentially unchanged in their proportions of faculty, but in both cases, the number of departments with at least one specialist in the field grew significantly. In 2005, 82.0 percent of the departments reported at least one Asia specialist (up from 73.5 percent), while departments with a specialist listed in the Middle East history grew from 47.0 percent to 54.5 percent.
American history remains the largest category and essentially unchanged in either the proportion of faculty listed (near 43 percent) or the number of departments with at least one specialist (100 percent).
Generational Changes
As another way of looking at this data, we also broke down the field specializations for full-time faculty listed in the 2005 Directory into 5-year degree cohorts. As shown in Figure 5, the results seem to track many of the trends shown over time in the Directory.
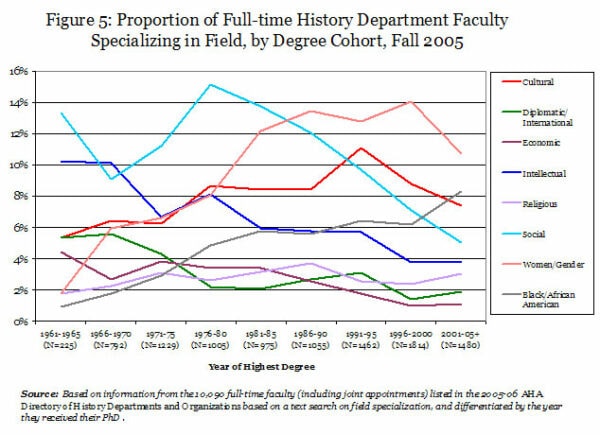
Figure 5
As this demonstrates, the fields with a declining proportion of history faculty—particularly diplomatic, economic, and intellectual history—were also more likely to be selected by a disproportionate number of historians who received their PhDs more than 30 years ago.
In the 2005 Directory, 22.8 percent of the full-time faculty earned their degrees before 1976. In comparison, 39.8 percent of the faculty designated as doing diplomatic or international history were in that cohort, 34.7 percent of the economic historians, 31.7 percent of the intellectual historians.
Conversely, while 47.1 percent of the full-time faculty earned their degrees since 1989, more than half of the faculty whose work was designated in the fields of cultural history, the history women and gender, or African American history, were in that cohort.
The one obvious anomaly in this data is the field of social history, where 40.9 percent of the designated historians earned their degrees in the middle cohort (1976 to 1989), as compared to 30.1 percent of all the listed faculty.
One other important factor needs to be considered in the weighing these findings, as the selection of topical field labels is modestly lower among those who received their PhDs within the past ten years. That probably reflects different practices for senior and junior faculty, as the younger historians are more likely to spend most of their time teaching broad survey courses, while senior faculty tend to limit their teaching to more specialized upper-level courses.
We offer this as a report of work in progress. As the many caveats and stipulations suggest, these findings should be read with some caution. We assume that the labels historians give to their work matter, and that changes in the adoption of certain labels over time can help to mark changes in the discipline.
Nevertheless, these labels also tend to be fairly crude measures, which clearly do not reflect the fullness of any particular historian’s work. We hope this can generate some thought and comment about the labels we use—though ideally without the sense of alarm generated by the Council’s psychohistory decision.
We welcome your comments and suggestions.
Keywords Used in Identifying Specific Field Specializations
| Africa | Latin America | United States |
| Africa (excluding African American) | Brazil | Southwest |
| Mexico | New York | |
| Asia | Chile | Texas |
| China/Chinese (excluding Chinese American) | Argentina | California |
| India/Indian | Andes/Andean | Florida |
| Vietnam | Cuba | U.S. |
| Japan | Peru | Civil War (excluding “English”) |
| Korea | Colombia | Reconstruction |
| Far East | Central America | Gilded Age/Progressive Era |
| South America | New Deal | |
| Europe | Caribbean | South (excluding “South America”) |
| Spain | ||
| Italy | Middle East | |
| France/French | Near East | |
| German | Islam | |
| Britain/British/England/ Ireland/United Kingdom | Persia | |
| Russia/Soviet | Iran | |
| Byzantine | Egypt | |
| Scandinavia | Iraq | |
| Middle Ages | Israel | |
| Greece/Rome | Palestine | |
| Renaissance/Reformation |
Notes
Richard Bond, Carl Ashley, and Liz Townsend assisted in the scanning and preparation of the files. Special thanks are also due to all those who posed questions that prompted us to dig into the data and generate this report.
- Data scanned in for editions of the Guide/Directory prepared in the summers of 1975, 1980, 1985, 1990, 1995, 2000, and 2005. Each faculty listing was proofed for errors and each faculty member saved to a separate record, keyed to department and rank. Staff then performed a keyword search on each of the labels in the study. The topical keywords were specific as indicated in the figures, while the geographic tabulation included specific countries within a given region (“China” and “India” in Asia, for instance) as well as specific temporal periods in a particular region (such as “Reconstruction” in the U.S. and “Renaissance” in Europe). Please see the keyword list for all text used as selectors. [↩]