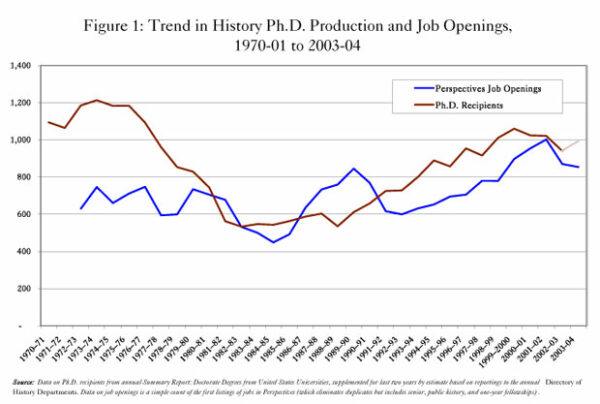
Figure 1
Job listings in Perspectives declined slightly during academic year 2003–04—following a sharp drop in the previous academic year—led by declines in the number of jobs open to junior faculty. Meanwhile, on the supply side of the job market, the number of new PhDs and the number of new graduate students admitted to history PhD programs both increased.
The one piece of really good news in our assessment of the job market is that the number of full-time faculty employed in the departments listed in the 2004–05 Directory of History Departments rose modestly for the third year in a row.
A wider survey of the placement of history PhDs over the past 15 years points to deeper—and more troubling—trends in the job market. Only one-third of the people who received PhDs from history departments over the past 15 years found jobs in the departments and organizations listed in the latest edition of the Directory.
The survey also found that the pool of applicants is much larger than previously suspected. One out of every three faculty hired by listing departments in the United States received their PhDs either in another discipline or from a university located in another country.
Broad Trends in Jobs and PhDs
Jobs advertised in Perspectives fell 1.8 percent from the year before, from 870 to 854, even as the number of new PhDs reported to the Directory rose 6.5 percent. As Figure 1 demonstrates, it has now been 12 years since we could report there were more new jobs than PhDs.
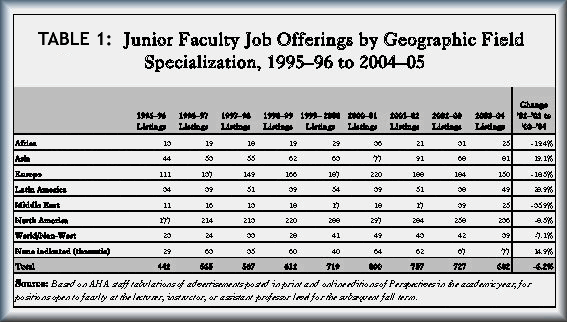 As bad as those trends might appear, they actually understate the problems for new PhDs. Many of the openings advertised are only for senior members of the profession and short-term postdoctoral fellowships (which were counted for this survey only if they paid more than $25,000 per year). This proved particularly true this year, when we found that the number of jobs advertised to junior scholars declined 6.2 percent (Table 1).
Openings for history faculty at the instructor and assistant professor level fell from 727 positions advertised in 2002–03 to 682 in 2003–04, the lowest point in the past five years. Most worrisome are the declines in fields with the most PhDs—North American and European history. Job openings in European history fell 18.5 percent from the year before, to 150 openings—the lowest level since the 1997–98 academic year. Openings for junior faculty in the history of North America decreased by 8.5 percent to 236 positions—again a five-year low.
The sharpest decline was in the field of Middle East history (down by more than one-third), but that possibly indicates a corrective retreat from the anomalous and transient two-fold jump in the number of openings after (and prompted by) September 11. In contrast, there were clear gains for the fields of Asian and Latin American history, and solid improvements in fields that fall outside the usual geographic categories used by Perspectives, either because they have a thematic or international focus.
Looking at where the jobs are, we find job growth in regions along the East Coast, which is balanced against declines in other regions and outside the country. In the North and Southeast, growth in the number of new jobs pushed the number of openings to their second highest level in the past 15 years. In every other region however, the number of junior faculty jobs slipped to their lowest level in the past three to five years.
Long Term Trends: Admissions Rising, Retirements Falling
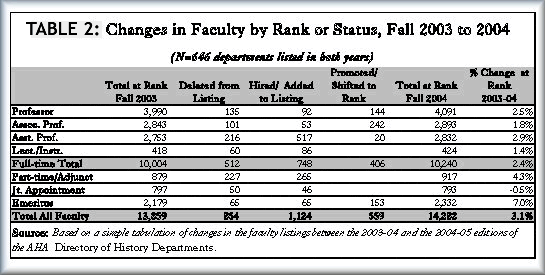 There is some good news in the faculty listings in the new Directory, as the 646 departments listed in the past two directories reported that the number of full-time faculty employed in the department increased by 236, a rise of 2.4 percent (Table 2).
Notably, for the first time in more than a decade, the number of promotions to full professor exceeded the number retiring from that rank, as the proportion of full and associate professors leaving their departments fell to the lowest level in more than a decade.
This may be an anomalous year, however, as an unprecedentedly large proportion of the full-time faculty in history departments remain at or near retirement age. In the 2004–05 Directory, 23 percent of the full-time faculty listed had received their PhDs more than 30 years ago (Figure 2). Insofar as the average age of new history PhDs in the early 1970s was 31, this means an exceptionally large number of faculty are now in their late 50s or older.1
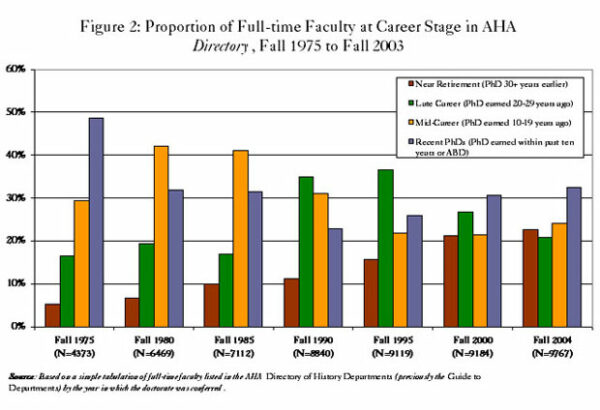
Figure 2
Even though the pace of retirements from history departments eased a bit, departments are under intense pressure to find more faculty for the classroom. The net growth in the number of faculty has been sustained by a large increase in the number of undergraduate students taking history courses. As we have noted in our recent surveys of trends in student enrollments and majors, history departments are under increasing pressure to find teachers for a growing number of undergraduate students and history majors.2
Taking a look at some of the other measures of long-term trends for the job market, we see some other troubling signs on the horizon. For the third year in a row, history PhD programs are projecting a 4 percent increase in the number of new graduate students admitted to their programs. In the fall of 2003, 2,682 graduate students matriculated into history PhD programs—the most since fall 1996. History PhD programs estimated that they would bring in another 2,794 students in the fall of 2004—a further increase of 112 new students (Figure 3). Not surprisingly, we see an increase (albeit modest) in the total number of graduate students in history PhD programs—from 11,376 graduate students to 11,739 last fall.
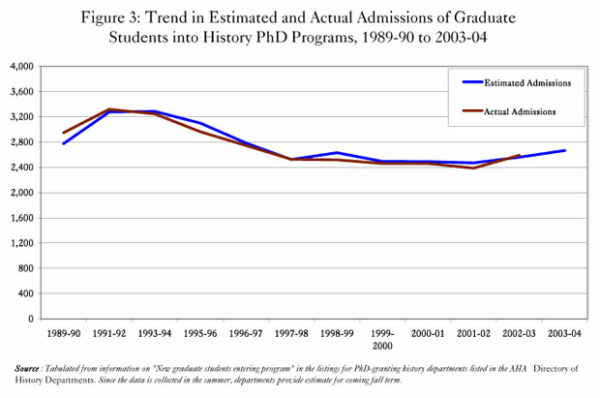
Figure 3
Given that it takes an average of almost eight years to complete the PhD, however, this recent upward trend has not yet extended into the number of doctoral dissertations now in preparation. Taking a look at the listings in the AHA’s Dissertations in Progress database, we find evidence that the number of dissertations approaching completion fell for the fifth year, from 3,427 to 3,192, the lowest number since the AHA began collecting the data in 1997–98, when departments reported more than 4,000 dissertations in progress (although it should be noted that at least part of the decline could be attributed to a more systematic effort made in fall 2004 to update the information).
Where the PhDs Are: A Look at the Past 15 Years
A persistent complaint about our annual job surveys is that they provide only snapshots of a particular moment in time, failing to take into account the long-term trends and movements in the number of history PhDs—particularly of those who fail to find full-time employment and linger on the job market year after year, thereby adding to the number of job applicants.
While we cannot accurately measure such trends, it is possible to gain an impressionistic sense of this larger picture. To this end, staff compiled data about the 11,562 history PhDs reported to the Directory over the past 15 years (from the 1989–90 academic year to the 2003–04 academic year). We then compared the names in this database to the listings of 17,111 departmental faculty and staff at organizations in the United States in the new Directory (which was prepared in summer 2004).3
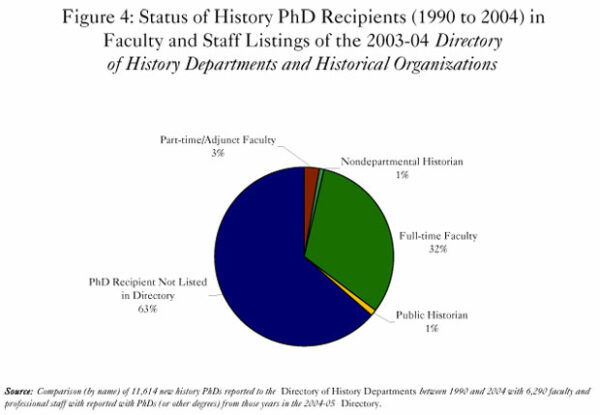
Figure 4
The results are quite troubling. Almost two-thirds (63 percent) of the history PhDs reported to the Directory over the past 15 years had not found employment in a listing department or organization (Figure 4).
This is hardly a perfect test of the job market for history PhDs. It leaves out a wide range of small and interdisciplinary departments, as well as departments and programs outside the discipline, in which history PhDs might have found employment.4 It also comprises only a tiny number of public history employers. Nevertheless, as the recent report of the AHA’s Committee on Graduate Education suggests, the Directory does provide a fairly close representation of the job market for which most history PhDs are trained.5
Depending on what is being measured, the elite institutions were both more and less successful in placing their students. Departments rated in the top 25 percent of the National Research Council’s rankings of history PhD programs in 1993 managed to place 42.6 percent of their students in listed institutions, which was clearly better than the 23.5 percent placement rate for those who received their PhDs from programs in the bottom quarter.
Since the top 25 percent produced almost half of PhDs, however, they also produced a much larger proportion of the PhDs who did not find employment in the current Directory. The top 30 programs in the NRC rankings awarded 5,695 PhDs, as compared to 5,919 conferred at the other 123 programs. So despite the higher average placement rate, 3,164 PhDs from the top schools did not find employment in a listing department or organization, as compared to 4,232 from all the other programs.
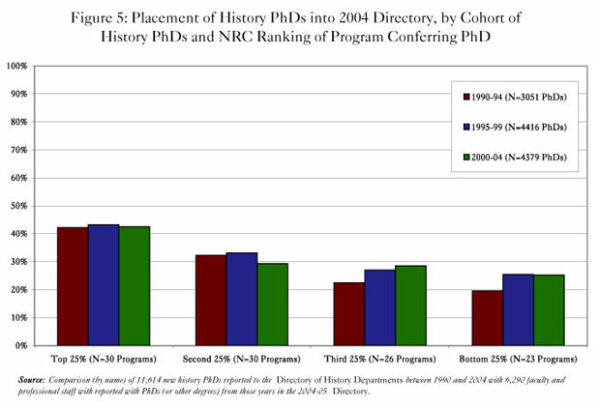
Figure 5
The top-ranked institutions did have a marked edge in their ability to place their students despite fluctuations in the job market. When we separate the PhD recipients into three five-year cohorts (1990–94, 1995–99, 2000–04), we find that the placement rate for PhDs in top tier programs has been steady at around 43 percent through all 15 years (Figure 5). In comparison, PhDs from other programs clearly did worse as the job market fell to its nadir in 1994, and then benefited from the resurgence in jobs in the next five years.
The data for the most recent cohort (2000–04) is a bit less clear because it includes PhDs conferred as recently as last May, and we know from past surveys that most PhDs who find long-term employment in the academy tend to find it one to three years after receiving the degree. In spite of that, and consonant with the growth in the number of full-time faculty in recent years, the placement rates have not fallen as sharply as the job advertisements.
One might object that a portion of the PhDs who did not find employment in Directory institutions were foreign born, and therefore likely to have returned to institutions in their home countries. To test this, we did a special tabulation of the 10.3 percent of the recent PhDs with undergraduate degrees from foreign colleges and universities. Since that proportion is close to federal estimates of new history PhDs who are noncitizens, this seems to be a reasonable measure of this group.6
We found that programs in the top half of the NRC rankings had a larger proportion of these “non-native” PhDs, as 11.4 percent of their students had undergraduate degrees from foreign institutions. This compared to an average of less than 9.7 percent at the other history departments and programs. The placement rates for these presumptively foreign-born PhDs was approximately a third lower than the placement rates for their counterparts with undergraduate degrees from domestic institutions.
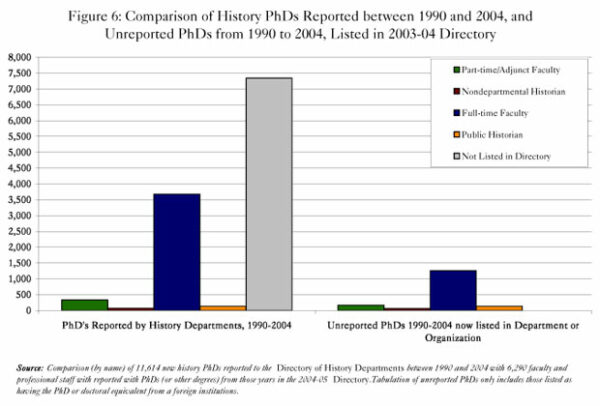
Figure 6
Perhaps more importantly, this survey indicates that we have significantly underestimated the pool of applicants competing for jobs in history departments and organizations. Based on the data from the federally funded Survey of Earned Doctorates, we have normally assumed that the PhDs reported by departments listed in the Directory undercounted the number of people seeking to enter the history job market by about 9 percent. When we look at those who found employment in history departments over the past 15 years, however, we found that almost one-third of the listed faculty and professional staff with PhDs from 1990 to 2004 did not come from a domestic history PhD program (Figure 6).
The listing departments and organizations in the 2004–05 Directory reported employing 5,865 faculty and staff who had received doctorates between 1990 and 2004. Of that number, 4,242 were in our database of PhDs completed at U.S. history departments in those years. The remaining 1,623 came from (in most cases) a non-history department, a specialized history department, or from overseas universities.
While our current staff resources did not permit us to track down a c.v. for everyone, we do know that 326 received PhDs from an overseas institution. A plurality of these came from institutions in the United Kingdom (141), trailed at a distance by universities in Canada (93), Germany (32), and France (14). Perhaps less surprisingly, most of the domestic PhDs (859) came from the same colleges and universities as the top 30 programs in the NRC rankings of history departments, led by Harvard (77), UCLA (71), and Yale (67).
A survey of online c.v.’s and biographies for a random sample of 100 of the others, suggests that most came from an area or topical studies program. No other disciplinary department comprised a clear plurality, but classics, American studies, and some variation on religion or theology stood out.7
It need not necessarily be a source of despair that so many history PhDs have failed to find employment in a history department. After all, the most recent federal survey of humanities PhDs found that historians who had found a job outside academia were better paid and generally enjoyed greater job satisfaction.8 It is, nevertheless, a cause for concern. As the AHA’s Committee on Graduate Education, pointed out, the training of new PhDs concentrates primarily (and often exclusively) on a career producing monographic research. Given that focus, it is troubling that just 15.8 percent of the history PhDs found full-time employment at a history department in a doctoral or research university.
Richard E. Bond and Liz Townsend of the Directory staff assisted with the tabulation of changes in the Directory listings and with scanning in of the listings of previous PhDs.
Notes
- Average age from “A profile of research doctorates, 1960–2000, History (Total),” prepared for the American Historical Association by the National Opinion Research Center, 2002. Despite the ending of the mandatory retirement age, recent studies have found that approximately 75 percent of faculty will retire before the age of 70. Cf., Orley Ashenfelter and David Carr, Did the Elimination of Mandatory Retirement Affect Faculty Retirement Flows? (New York: National Bureau of Economic Research, 2001). [↩]
- Robert B. Townsend, “Latest Figures Show Sizeable Increases in History Majors and Bachelor’s Degrees,” Perspectives (April 2004), 17. [↩]
- Database of history PhDs compiled from “Dissertations Completed” reported to the Directory of History Departments and Organizations (previously the Guide to Departments of History) from the 1990–91 edition to the 2004–05 editions. This was supplemented by a request to departments for listings of their PhDs in fall of 2003 and 2004. Staff then did a name-by-name comparison comparing first by last name, school, and year of degree, and then performing a second comparison by school, year of degree, and name to try to catch instances where the last name had been changed. [↩]
- Based on a comparison to the Department of Education’s National Survey of Postsecondary Faculty (last done in fall 1998) staff estimate that the departments listed in the Directory comprise 68 percent of the full-time history faculty in the United States. [↩]
- Thomas Bender, et al., The Education of Historians for the Twenty-first Century (Urbana-Champaign: University of Illinois Press, 2004), 20–23. [↩]
- This information is tracked in “profile of research doctorates, 1960–2000, History” and Thomas B. Hoffer, et al., Doctorate Recipients from United States Universities: Summary Report 2002 (Chicago: National Opinion Research Center, 2003). [↩]
- We conducted this survey by finding the online c.v.’s of 100 randomly selected names from the list of PhDs who had not been reported in the Directory. Unfortunately, a significant portion of them (46) did identify the conferring institution, not the department. Among the remainder, five had received degrees from religion or theology programs, four were from classics departments, and three had degrees from American studies programs. [↩]
- Linda Ingram and Prudence Brown, Humanities Doctorates in the United States: 1995 Profile (Washington, D.C.: National Academy Press, 1997). [↩]