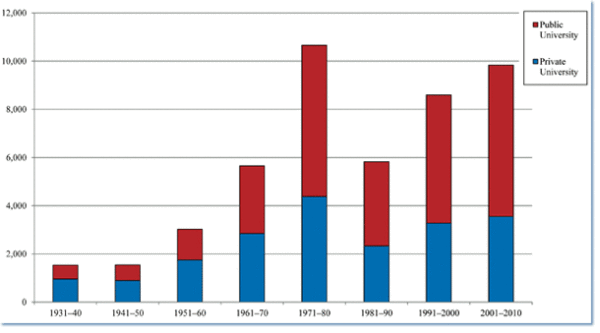
After three years of growth, the number of new PhDs drifted slightly lower in the 2009–10 academic year—declining from 1,045 the year before to 1,009. Despite the decline, more history PhDs were conferred in the past decade than in any decade except the 1970s (falling just 820 degrees short of that high-water mark) (Figure 1).

Figure 1: History PhDs Conferred by Decade and Institutional Control, 1971 to 2010. Sources: Data for period 1931 to 1970 taken from Warren F. Kuehl, Dissertations in History (3 vols.) as supplemented with information collected for the AHA’s Directory of History Dissertations. Data for the period since 1971 derived from the annual Survey of Earned Doctorates.
The annual snapshot of new PhDs from the National Science Foundation provides the clearest insight into trends in doctoral study, providing vital evidence about who is receiving degrees in the field and their employment prospects at the time they earned the degree.1 The new data also provides the first clear evidence of the effects of the recent sharp decline in the number of history jobs, while also showing ongoing change in the demographic makeup of new PhDs entering the field. The 2010 cohort of history PhDs had the highest proportion of women and racial and ethnic minorities on record, but on average was carrying more debt at the time they earned their degrees than their predecessors.
The Effects of the Job Market
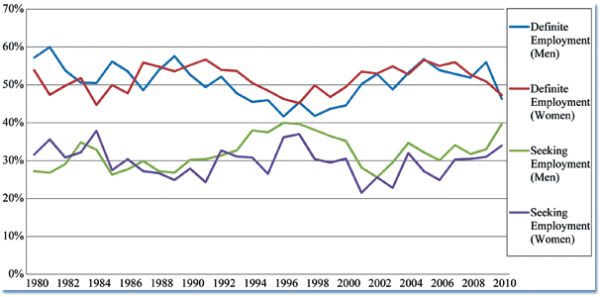
Reflecting the recent difficulties of the job market, fewer than half of the new PhDs reported that they had definite employment when they received their degree. Only 46.7 percent of the respondents reported a job in hand, down significantly from an average of 53.4 percent of the new history PhDs over the past decade (Figure 2).

Figure 2: Reported Employment Status at Time of Degree, by Gender, 1980 to 2010. Source: Data on PhD recipients from annual reports on Doctorate Recipients from U.S. Universities (released by National Academies Press, National Opinion Research Center, and National Science Foundation).
Part of the difference is a recent increase in the number of newly-minted PhDs taking postdoctoral appointments, as 13.1 percent of the new PhDs reported that they had some form of definite postgraduate study planned. This is up sharply in recent years, and reflects a number of recent initiatives to provide a haven for new degree recipients until the job market improves. In comparison, a decade earlier only 6.6 percent of new history PhDs reported they were heading on to postdoctoral study.
Despite the efforts to provide postdoctoral opportunities, 37.1 percent of the respondents reported that they were still actively seeking employment or other study opportunities. This too marks a significant shift, as over the past decade an average of less than 30 percent of the new PhDs were still seeking positions at the time they earned their degrees.
These trends were consistent for both men and women earning the history PhD, though a higher proportion of men were still seeking work in 2010 (39.7 percent as compared to 34.0 percent of women).
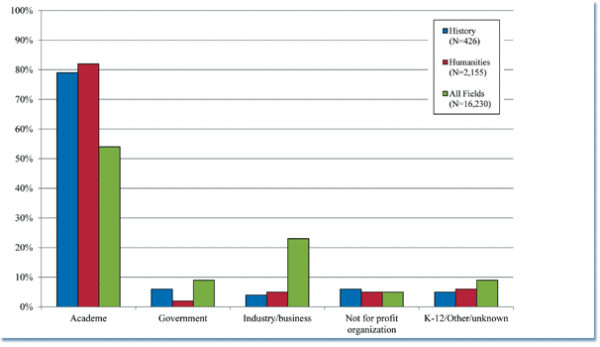
Among those doctorates who had found employment, 79.3 percent reported they had taken jobs in academia. But 6.1 percent said they had jobs in the government, 4 percent had jobs in business, and another 5.6 percent had positions in nonprofit organizations, and 4.9 percent were employed in “other” activities, principally in elementary and secondary schools (Figure 3).

Figure 3: Area of Employment for 2010 PhD Recipients with “Definite Employment.” Source: Survey of Earned Doctorates. Table based only on those respondents who indicated they had “Definite Employment at the time they earned the degree.
Given the very large proportion of PhDs in history (and the other humanities) either in postdoctoral positions or still seeking work at the time they earned their degrees, these proportions will not reflect the actual long-term employment areas of history PhDs over time. But they do accurately reflect the aspirational goals of most PhD candidates.2
The report also provides useful evidence about the relative financial situation of PhDs taking positions in the different employment areas as they earned their degrees. On average, new humanities PhDs reported earning an average of $47,157 in academia. This compared to an average of $50,626 in business, $51,113 in non-profit organizations, and $65,715 in government. Humanities PhDs employed in “other” fields of employment—primarily in the elementary and secondary schools—reported earning an average of $50,000.
The average salary for new PhDs in academia fell about 15 percent below the average for all fields in academia and government positions, 26.9 percent below the average for posts in nonprofit organizations, and 43.4 percent the average for positions in business and industry. The average salaries in the latter two categories are skewed up sharply by doctors in business, economics and the sciences.
While their salaries are significantly lower than PhDs in other fields, humanities PhDs also left with significantly less debt than their counterparts in the other fields. Nevertheless, the new cohort of humanities PhDs finished their studies with an average of $27,352 in education-related debt—consisting of an average of $20,041 in debts accumulated in graduate school, and another $7,446 in debts accumulated while earning an undergraduate degree.
The proportion of new humanities PhDs leaving with more than $30,000 in additional debts from the graduate studies has grown steadily over the past decade—from 19 percent of the new doctoral degree recipients in 2001 to 26.3 percent of the total in 2010. The percentage leaving with no additional debt also fell, from 53.7 percent to 51.7 percent of the new PhDs.
While the proportion of students adding to their debts seemed to increase, other data gathered by the AHA shows the proportion of students receiving some form of financial aid has remained fairly steady in history doctoral programs—at around 70 percent per over the past decade. As many doctoral students can attest, however, those funds rarely cover all expenses or the entire term of studies. The growing proportion of students leaving with a substantial debt significantly adds to the challenges for students entering the current job market.
A Changing Profile of History PhDs
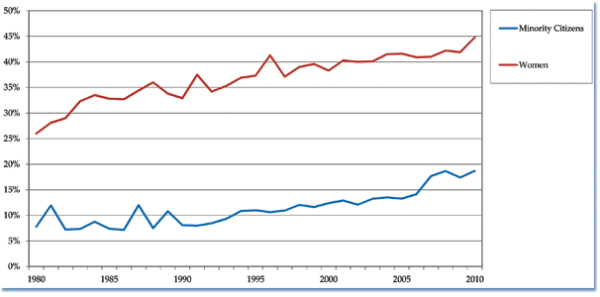
Alongside the recent changes in the financial situation for new history PhDs, there are marked changes in the demographics of recent doctoral degree recipients in the discipline. Notably, the proportion of women earning doctorates in history rose almost 7 percent—from 41.9 percent to 44.8 percent—the highest point ever recorded for our discipline (Figure 4).

Figure 4: Proportion of Women and Minorities Receiving History PhDs, 1980 to 2010. Source: Data from the annual Doctorate Recipients from United States Universities: Summary Report. “Minority citizens” include all U.S. citizens and non-U.S. citizens with permanent visas who indicated their racial or ethnic origins were American Indian, Asian, Black, Hispanic, or “Two or more races.” Women include all history PhDs (citizen and non-citizen).
Despite the change, the representation of women earning history degrees remains quite low relative to the other humanities and social science disciplines. In the humanities as a whole, women earned 51.6 percent of the doctoral degrees in 2010. In the social sciences, their representation increased to 57.4 percent.
While the representation of women increased sharply, there are marked differences in the demographic characteristics of male and female history PhDs. Most notably, women were far more likely to be single and never married than their male counterparts. While 56.4 percent of the men earning doctorates were married, only 48 percent of women reported a similar status. And female PhDs were twice as likely to be separated, divorced, or widowed as men—7.7 percent as compared to 3.1 percent.
Alongside the growth in the representation of women, the proportion of racial and ethnic minorities also increased, from 17.4 to 18.7 percent of the new PhD recipients. This was also a historical high point.
Most of the increase came from a growth in the representation of African American and Hispanic historians, as the proportion of new history PhDs in both categories increased 6.1 percent. The proportion of American Indian history PhDs also increased, to 0.6 percent of the total, while the proportion of Asian Americans fell slightly to 3.6 percent. The proportion of multi-race history PhDs was essentially unchanged at 2.3 percent.3
While the racial and gender composition of the field is changing, the time spent earning the degree remains relatively steady, as the new cohort of history PhDs reported earning the degree an average of 11.3 years after the received their bachelor’s degrees, and 9.4 years after starting graduate studies.
History was essentially the same as the other humanities fields in the time spent earning the degree, but students in all disciplines earned the degree about two years faster (at an average of 9.3 years since the undergraduate degree and 7.7 years since the start of graduate school). Not surprisingly then, the new history PhDs were about two years older than their counterparts in other fields, at an average of 34.2 years of age as compared to 32.2.
The time spent earning the degree was consistent for both men and women earning the history PhD, though men in the 2010 cohort were a year older on average than their female counterparts.
Looking Ahead
As indicated in the January jobs report, history PhD programs have been cutting back on admissions over the past two years—declining from an average of almost 9 new students matriculating into PhD programs in 2006 to just 8.2 in 2011. Most of the reductions occurred at large programs, which reported admitting an average of two fewer students per year.
Even with the reductions in admissions, given the lengthy period of time spent earning the degree, we are not likely to see the effects of those reductions for another six years or so.
Meanwhile, the gap between academic jobs and new PhDs in history is likely to remain quite wide, barring a significant change in the academic job market.
Notes
- Data for this analysis is available at the National Science Foundation’s “Science and Engineering Doctorates: 2010” web site at www.nsf.gov/statistics/sed/data_table.cfm (particularly tables 22, 24, 39, 49, 66, and 67). [↩]
- For a closer analysis of the long-term prospects for history PhDs, see Robert B. Townsend, “The Ecology of the History Job: Shifting Realities in a Fluid Market,” Perspectives on History (December 2011). [↩]
- For comparison, the 2010 U.S. census found that 16.3 percent of the population identified as Hispanic or Latino, 12.6 percent as Black or African American, 0.9 percent as American Indian, 4.8 percent as Asian, 0.2 percent as Native Hawaiian or Pacific Islander, and 9.1 percent as another race or some combination of two or more of the others. Data from Table 1 of Karen R. Humes, Nicholas A. Jones and Roberto R. Ramirez, “Overview of Race and Hispanic Origin: 2010” (March 2011) at census.gov/prod/cen2010/briefs/c2010br-02.pdf. [↩]

