The number of new history bachelor’s degrees reached the highest level in 30 years in 2004–05, as the nation’s colleges and universities conferred 31,398 degrees. This marked an increase of 5.3 percent over the previous year.1
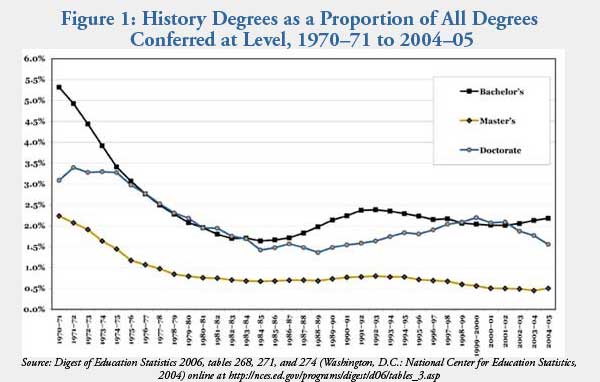
History easily surpassed the average growth among all disciplines, where the number of new undergraduate degrees increased by just 2.8 percent. In relative terms, history degrees now account for 2.18 percent of the baccalaureate degrees conferred (Figure 1). That is not a huge amount compared to other humanities and social science fields such as English (which conferred 3.78 percent of the degrees) and political science and government (at 2.65 percent). But this is much better than 15 years ago—when history fell to just barely 1.5 percent of the undergraduate degrees conferred—and coincides with a general increase in the number of undergraduate students.

Figure 1
The last time the annual number of history degrees exceeded 31,000 was the 1974–75 academic year, at a time when history conferred 3.41 percent of the baccalaureate degrees. But as history fell out of the core requirements at many universities in the 1970s and 1980s, and student interests shifted to more career-oriented fields, the number of new history degrees decreased more than 48 percent to 16,049 in 1984–85.
The number of new master’s degrees conferred in history in 2004–05 was up by 14.7 percent from the year before, to 2,893 degrees. Despite modest growth since 2000–01, the number of new master’s degrees remains a bit low historically for the field. More master’s degrees were conferred in the mid-1990s—as part of the surge of doctoral students in those years—and more than twice as many were conferred in the 1960s and early 1970s.
In contrast to the growth in lower-level degrees, the number of history doctoral degrees conferred fell 4.2 percent, from 855 to 819 new PhDs conferred. This marked the fifth year of declines in the number of new history doctorates, as the number of new degrees is now 16.8 percent below the number conferred in 1999–2000.2
The continuing rise in undergraduate degrees and declining number of PhDs competing for jobs offers some further hope for continued improvement in the academic job market.
The Demographics of New History Degrees
The demographics of the students receiving history degrees was essentially unchanged from the year before.
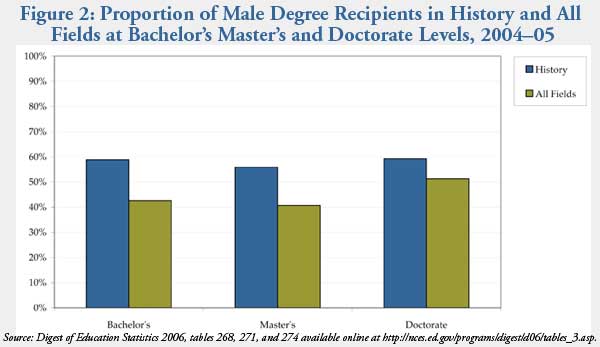
At the undergraduate level, 58.8 percent of the new degree recipients were men. This is substantially different from the other disciplines, where men constituted just 42.6 percent of those receiving bachelor’s degrees (Figure 2). And history remains quite unusual even among the humanities and social sciences. In the humanities fields, 41.6 percent of the undergraduate degree recipients were men, while in the social sciences 47.2 percent were men.

Figure 2
The disparity is less pronounced at the master’s and doctoral levels. Men earned a slightly smaller proportion of history degrees at the MA level (55.9 percent), but also earned fewer degrees at the master’s level in all fields (40.7 percent). A much larger proportion of the new history PhDs were men (59.2 percent), but men earn a majority of the doctorates conferred in all fields (51.2 percent), so the difference between history and the other fields is less pronounced at this level.
The racial profile of new history degree recipients is somewhat closer to the other disciplines. In history, 83.7 percent of the new degree recipients reported as white, as compared to 72.9 percent of the degree recipients in all fields.
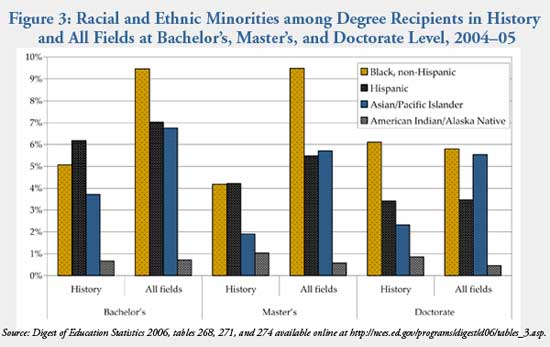
Among racial and ethnic minorities, history attracts an unusually small number of African American students at the undergraduate level. While black, non-Hispanic students earned 9.5 percent of the bachelor’s degrees in all fields, they received just 5.1 percent of the undergraduate degrees in history (Figure 3). History is one of the few disciplines where Hispanic Americans received the second highest proportion of undergraduate degrees, earning 6.2 percent (as compared to 7.0 percent among all fields). History also attracts an unusually small segment of Asian Americans as well. Asian/Pacific Islanders received 6.8 percent of the baccalaureate degrees in all fields, but only 3.7 percent of the degrees in history. It is only the case of Native American/Alaskan natives that history exactly matches other disciplines—undergraduates in these demographic categories constituted just 0.7 percent in both history and all fields.

Figure 3
The demographics of those earning graduate degrees in history is notably different, both in comparison to history degrees conferred at other levels and in comparison to other fields. At the master’s level, 66 percent of the degree recipients were white, as compared to 84.2 percent of those receiving history degrees. In comparison to the representation of minorities at the baccalaureate level, the proportion of black, non-Hispanic students, Hispanics, and Asian Americans are all significantly smaller.
At the doctoral level, however, history is quite close to the average for all fields in the representation of minorities in all categories except Asian American students. A slightly higher proportion of black, non-Hispanic students earned PhDs in history, than in all other fields (6.1 percent in as compared to 5.8 percent among all fields). Hispanic Americans earn doctorates in history at roughly the same rate as other fields (both near 6.5 percent), while a slightly higher proportion of Native Americans earn degrees in history (0.9 percent in history as compared 0.5 percent of the degrees in history).
The fact that the proportion of black, non-Hispanic degree recipients increases between the undergraduate and doctoral levels in history seems to beg the question about where they earned their undergraduate degrees. As it turns out, a significant portion of the new black, non-Hispanic degree recipients (6 of 48) earned their degrees overseas. Over the past 30 years, since the Department of Education started asking the question, almost 15 percent of black, non-Hispanic history PhDs had earned their undergraduate degree overseas. It may be worth noting, however, that almost all of the PhDs counted under this category (which is designated by the reporting institutions) are not U.S. citizens.3
But this also calls attention to the broad category of “area, ethnic, cultural, and gender studies,” which accounted for 7,569 of the new undergraduate degrees (0.5 percent of the degrees conferred) in 2004–05. It can be argued that these fields, which often have a historical content, siphon off a significant number of women and minorities at the undergraduate level. This argument is supported by the demographics of degree recipients in those fields. More than 69.5 percent of the bachelor’s degree recipients in 2004–05 were women, and 44.3 percent were from racial or ethnic minorities.
There is no way of measuring the number of students entering history from these departments, but it is worth keeping in mind as a potential recruiting ground to draw more minority and female students to history doctoral studies.
Notes
- The information on new degrees is contained in section on postsecondary education in the National Center for Education Statistics Digest of Education Statistics, 2006 available online at https://nces.ed.gov/programs/digest/d06/tables_3.asp. [↩]
- The numbers reported in this federal survey are slightly lower than the numbers in the federal Survey of Earned Doctorates (SED), discussed most recently in Robert B. Townsend, “History PhD Numbers Lowest in Almost a Decade as Job Listings Continue to Rise,”Perspectives (January 2007). The numbers indicated here are reported by the universities, while the SED allows new doctorate recipients to self-select the field of their degree—thus allowing students in other departments and programs, to declare history as their field. [↩]
- This was tabulated using the NSF’s WebCaspar system which allows more precise tabulations of the undergraduate origins of doctorate recipients at the institutional level. [↩]

